Comparative Study
. 2025 Jun;32(6):2027-2049.
doi: 10.1007/s43032-025-01864-0. Epub 2025 Apr 24.

Assessing Tocolytic Potency: Variability and Accuracy of AUC Versus Amplitude-Based Assessment of Pregnant Human Myometrial Contractions Ex Vivo

Affiliations
Comparative Study

Assessing Tocolytic Potency: Variability and Accuracy of AUC Versus Amplitude-Based Assessment of Pregnant Human Myometrial Contractions Ex Vivo

Md Reduanul Hossain et al. Reprod Sci. 2025 Jun.

Abstract

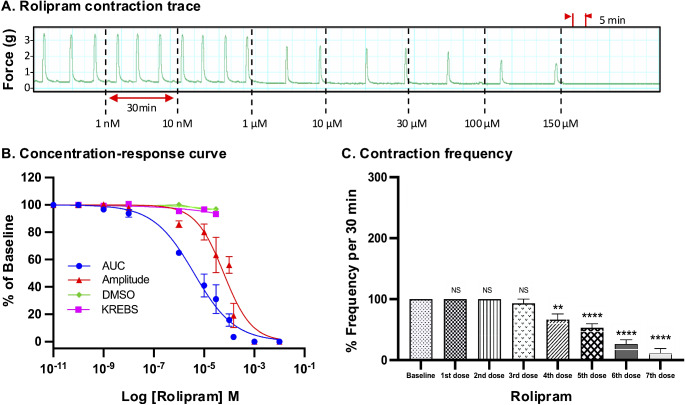
The methodological approaches used to evaluate the inhibitory effects (potency determination) of tocolytic agents on human uterine contractions in ex vivo systems vary, and none of the methodologies has been subjected to scrutiny in terms of objectivity, variability, and reliability. Therefore, this study aimed to assess and compare the reliability of using area under the curve (AUC) versus amplitude alone-based assessment of contraction traces to generate concentration-response curves, which were then used to calculate the tocolytic concentrations that inhibited 25% (IC25) and 50% (IC50) of baseline contractility. The accuracy of the determined inhibitory concentrations (IC) was then scrutinized while taking into consideration the contraction parameters (amplitude, frequency, duration) affected by the different tocolytics. To do this, pregnant human myometrial strips (term, not-in-labor) were treated with cumulative concentrations of the contraction-blocking agents, nifedipine (NIF), indomethacin (IND), 2-aminoethoxydiphenyl borate (2-APB), glycyl-h-1152 (GH), aminophylline (AMP), or rolipram (ROL)). Concentration-response curves were generated using either AUC or amplitude alone as the index of contraction inhibition, from which tocolytic IC25 and IC50 concentrations were calculated and compared (i.e. IC25(AUC) vs. IC25(Amplitude)). The effects of each tocolytic on contraction frequency were also quantified. To assess accuracy, each tocolytic was applied to contracting strips as a single treatment at their respective IC25(AUC/Amplitude) and IC50(AUC/Amplitude), and then the inhibitory effect re-quantified against both contraction AUC and amplitude alone. Significant differences between IC50(AUC) and IC50(Amplitude) were detected for AMP (318.5 vs. 450 µM), ROL (4.3 vs. 55 µM), and IND (59.5 vs. 75 µM), whereas AUC versus amplitude-based IC50 concentrations were comparable for NIF (10 vs. 10 nM), GH (18.2 vs. 15 µM), and 2-APB (53 vs. 57 µM). Similarly, the determined IC25(AUC) and IC25(Amplitude) were again significantly different for AMP (175 vs. 277 µM), ROL (515 nM vs. 15 µM), and IND (28 vs. 42 µM), but also for 2-APB (27 vs. 40 µM). The confirmation studies revealed that a single dose of the tocolytics at their determined IC25(AUC) and IC50(AUC) concentrations consistently reduced contraction AUC by approximately 25% and 50%, respectively, whereas single doses of the IC25(Amplitude) and IC50(Amplitude) concentrations revealed inconsistent results. Of the six tocolytics, four reduced contraction amplitude by > 25% when applied as a single dose at IC25(Amplitude), while three reduced contraction amplitude by > 50% when applied at IC50(Amplitude). Our experimental data indicate that when determining tocolytic potency, assessment of ex vivo contraction traces via AUC is more accurate and consistent than assessment via amplitude alone. Our study finds that whilst tocolytics that increase contraction frequency (while decreasing amplitude) can be assessed by either AUC or amplitude-based determination, tocolytics that either significantly reduce or largely do not affect contraction frequency should only be analyzed via AUC.


Conflict of interest statement

Declarations. Ethical Approval: The study was approved by the Hunter and New England Area Human Research Ethics Committee (2019/ETH12330). Consent to Participate: All participants gave informed written consent. Consent for Publication: Not applicable. Persons: We are grateful to the pregnant women who donated myometrial samples, to our research midwife, Ms. Anne Wright, and acknowledge the help of the Obstetrics, Midwifery, and Surgical staff at the John Hunter Hospital, Newcastle. Competing Interests: The authors declare that they have no competing interests.

Figures

Fig. 1
Fig. 1
Concentration-response analysis of aminophylline. (A) A representative trace for the effect of cumulative treatment of aminophylline (n = 8) on spontaneous contractions. Dotted lines indicate the points at which treatments were added to the organ bath. (B) The plotted concentration-response curves for the effect of aminophylline on spontaneous pregnant human myometrial contractions ex vivo. Contractility was measured as AUC or amplitude and expressed relative to the contraction baseline (100%). (C) The effect of cumulative drug treatments on contraction frequency. The mean percentages of contraction frequency for the cumulative doses are expressed relative to the frequency baselines (100%). Data were checked for normality using the Shapiro-Wilk normality test and then analyzed by 1-way ANOVA with multiple comparisons (Dunnett’s relative to Baseline in all panels). Data are mean ± SEM. ****p ≤ 0.0001; ***p ≤ 0.001; **p ≤ 0.01; *p ≤ 0.05; NS, non-significant
Fig. 2
Fig. 2
Concentration-response analysis of rolipram. (A) A representative trace for the effect of cumulative treatment of rolipram (n = 8) on spontaneous contractions. Dotted lines indicate the points at which treatments were added to the organ bath. (B) The plotted concentration-response curves for the effect of rolipram on spontaneous pregnant human myometrial contractions ex vivo. Contractility was measured as AUC or amplitude and expressed relative to the contraction baseline (100%). (C) The effect of cumulative drug treatments on contraction frequency. The mean percentages of contraction frequency for the cumulative doses are expressed relative to the frequency baselines (100%). Data were checked for normality using the Shapiro-Wilk normality test and then analyzed by 1-way ANOVA with multiple comparisons (Dunnett’s relative to Baseline in all panels). Data are mean ± SEM. ****p ≤ 0.0001; ***p ≤ 0.001; **p ≤ 0.01; *p ≤ 0.05; NS, non-significant
Fig. 3
Fig. 3
Concentration-response analysis of indomethacin. (A) A representative trace for the effect of cumulative treatment of indomethacin (n = 10) on spontaneous contractions. Dotted lines indicate the points at which treatments were added to the organ bath. (B) The plotted concentration-response curves for the effect of indomethacin on spontaneous pregnant human myometrial contractions ex vivo. Contractility was measured as AUC or amplitude and expressed relative to the contraction baseline (100%). (C) The effect of cumulative drug treatments on contraction frequency. The mean percentages of contraction frequency for the cumulative doses are expressed relative to the frequency baselines (100%). Data were checked for normality using the Shapiro-Wilk normality test and then analyzed by 1-way ANOVA with multiple comparisons (Dunnett’s relative to Baseline in all panels). Data are mean ± SEM. ****p ≤ 0.0001; ***p ≤ 0.001; **p ≤ 0.01; *p ≤ 0.05; NS, non-significant
Fig. 4
Fig. 4
Concentration-response analysis of nifedipine. (A) A representative trace for the effect of cumulative treatment of nifedipine (n = 10) on spontaneous contractions. Dotted lines indicate the points at which treatments were added to the organ bath. (B) The plotted concentration-response curves for the effect of nifedipine on spontaneous pregnant human myometrial contractions ex vivo. Contractility was measured as AUC or amplitude and expressed relative to the contraction baseline (100%). (C) The effect of cumulative drug treatments on contraction frequency. The mean percentages of contraction frequency for the cumulative doses are expressed relative to the frequency baselines (100%). Data were checked for normality using the Shapiro-Wilk normality test and then analyzed by 1-way ANOVA with multiple comparisons (Dunnett’s relative to Baseline in all panels). Data are mean ± SEM. ****p ≤ 0.000; ***p ≤ 0.001; **p ≤ 0.01; *p ≤ 0.05; NS, non-significant
Fig. 5
Fig. 5
Concentration-response analysis of glycyl-11-52. (A) A representative trace for the effect of cumulative treatment of glycyl-H-11-52 (n = 8) on spontaneous contractions. Dotted lines indicate the points at which treatments were added to the organ bath. (B) The plotted concentration-response curves for the effect of glycyl-11-52 on spontaneous pregnant human myometrial contractions ex vivo. Contractility was measured as AUC or amplitude and expressed relative to the contraction baseline (100%). (C) The effect of cumulative drug treatments on contraction frequency. The mean percentages of contraction frequency for the cumulative doses are expressed relative to the frequency baselines (100%). Data were checked for normality using the Shapiro-Wilk normality test and then analyzed by 1-way ANOVA with multiple comparisons (Dunnett’s relative to Baseline in all panels). Data are mean ± SEM. ****p ≤ 0.0001; ***p ≤ 0.001; **p ≤ 0.01; *p ≤ 0.05; NS, non-significant
Fig. 6
Fig. 6
Concentration-response analysis of 2-aminoethoxydiphenyl borate. (A) A representative trace for the effect of cumulative treatment of 2-aminoethoxydiphenyl borate (n = 8) on spontaneous contractions. Dotted lines indicate the points at which treatments were added to the organ bath. (B) The plotted concentration-response curves for the effect of 2-aminoethoxydiphenyl borate on spontaneous pregnant human myometrial contractions ex vivo. Contractility was measured as AUC or amplitude and expressed relative to the contraction baseline (100%). (C) The effect of cumulative drug treatments on contraction frequency. The mean percentages of contraction frequency for the cumulative doses are expressed relative to the frequency baselines (100%). Data were checked for normality using the Shapiro-Wilk normality test and then analyzed by 1-way ANOVA with multiple comparisons (Dunnett’s relative to Baseline in all panels). Data are mean ± SEM. ****p ≤ 0.0001; ***p ≤ 0.001; **p ≤ 0.01; *p ≤ 0.05; NS, non-significant
Fig. 7
Fig. 7
Overview of study layout. The effects of the IC25 concentrations were assessed/confirmed for each tocolytic via AUC and amplitude-based assessment. The above experimental layout was repeated for IC50 concentrations determined for each of the tocolytics
Fig. 8
Fig. 8
Assessment of the experimentally determined IC25(AUC) concentrations. Representative traces showing the extent of contraction inhibition following treatment of spontaneously contracting pregnant human myometrial strips with the experimentally determined AUC-based IC25 concentrations of (A) AMP (n = 10), (B) ROL (n = 5), (C) IND (n = 10), (D) NIF (n = 10), (E) GH (n = 10), and (F) 2-APB (n = 10). Dotted lines indicate the points at which the treatment was added to the organ bath. (G) The mean percentage inhibition of AUC (relative to the contraction AUC baselines, 100%) induced by each drug when applied at the IC25(AUC) for 60 min. (H) The mean percentage inhibition of amplitude (relative to the contraction amplitude baselines, 100%) induced by each drug when applied at the IC25(AUC) for 60 min. IC, inhibitory concentration; AUC, area under the curve; AMP, aminophylline; ROL, rolipram; IND, indomethacin; NIF, nifedipine; GH, glycyl-h-1152; 2-APB, 2-aminoethoxydiphenyl borate
Fig. 9
Fig. 9
Assessment of the experimentally determined IC50(AUC) concentrations. Representative traces showing the extent of contraction inhibition following treatment of pregnant human myometrial strips with the experimentally determined AUC-based IC50 concentrations for (A) AMP (n = 10), (B) ROL (n = 5), (C) IND (n = 10), (D) NIF (n = 10), (E) GH (n = 10) and (F) 2-APB (n = 10). Dotted lines indicate the points at which the treatment was added to the organ bath. (G) The mean percentage inhibition of AUC (relative to the contraction AUC baselines, 100%) induced by each drug when applied at the IC50(AUC) for 60 min. (H) The mean percentage inhibition of amplitude (relative to the contraction amplitude baselines, 100%) induced by each drug when applied at the IC50(AUC) for 60 min. IC, inhibitory concentration; AUC, area under the curve; AMP, aminophylline; ROL, rolipram; IND, indomethacin; NIF, nifedipine; GH, glycyl-h-1152; 2-APB, 2-aminoethoxydiphenyl borate
Fig. 10
Fig. 10
Assessment of the experimentally determined IC25(Amplitude) concentrations. Representative traces showing the extent of contraction inhibition following treatment of pregnant human myometrial strips with the experimentally determined amplitude-based IC25 concentrations for (A) AMP (n = 5), (B) ROL (n = 5), (C) IND (n = 5), (D) NIF (n = 5), (E) GH (n = 5) and (F) 2-APB (n = 5). Dotted lines indicate the points at which the treatment was added to the organ bath. (G) The mean percentage inhibition of amplitude (relative to the contraction amplitude baselines, 100%) induced by each drug when applied at the IC25(Amplitude) for 60 min. (H) The mean percentage inhibition of AUC (relative to the contraction AUC baselines, 100%) induced by each drug when applied at the IC25(Amplitude) for 60 min. IC, inhibitory concentration; AUC, area under the curve; AMP, aminophylline; ROL, rolipram; IND, indomethacin; NIF, nifedipine; GH, glycyl-h-1152; 2-APB, 2-aminoethoxydiphenyl borate
Fig. 11
Fig. 11
Assessment of the experimentally determined IC50(Amplitude) concentrations. Representative traces showing the extent of contraction inhibition following treatment of pregnant human myometrial strips with the experimentally determined amplitude-based IC50 concentrations for (A) AMP (n = 5), (B) ROL (n = 5), (C) IND (n = 5), (D) NIF (n = 5), (E) GH (n = 5) and (F) 2-APB (n = 5). Dotted lines indicate the points at which the treatment was added to the organ bath. (G) The mean percentage inhibition of amplitude (relative to the contraction amplitude baselines, 100%) induced by each drug when applied at the IC50(Amplitude) for 60 min. (H) The mean percentage inhibition of AUC (relative to the contraction AUC baselines, 100%) induced by each drug when applied at the IC50(Amplitude) for 60 min. IC, inhibitory concentration; AUC, area under the curve; AMP, aminophylline; ROL, rolipram; IND, indomethacin; NIF, nifedipine; GH, glycyl-h-1152; 2-APB, 2-aminoethoxydiphenyl borate
Fig. 12
Fig. 12
Illustration of two concentration-response curves with different slopes. A typical concentration-response curve is shown in blue. The IC25 and IC50 are the concentrations that lead to 25% and 50% of the maximal inhibition, respectively. Each curve has a different slope (Hill slope). For the blue curve, the Hill slope = 1, whereas for the red curve, the Hill slope = 3, demonstrating that the higher the Hill slope, the steeper the curve and the higher the IC values (IC25 and IC50). Hence the IC25 and IC50 concentrations derived from the two curves are markedly different

References

    1. Chawanpaiboon S, Vogel JP, Moller A-B, Lumbiganon P, Petzold M, Hogan D, Landoulsi S, Jampathong N, Kongwattanakul K, Laopaiboon M, Lewis C, Rattanakanokchai S, Teng DN, Thinkhamrop J, Watananirun K, Zhang J, Zhou W, Gülmezoglu AM. Global, regional, and National estimates of levels of preterm birth in 2014: a systematic review and modelling analysis. Lancet Global Health. 2019;7:e137–46. 10.1016/S2214-109X(18)30451-0. - PMC - PubMed
    1. Goldenberg RL, Culhane JF, Iams JD, Romero R. Epidemiology and causes of preterm birth. Lancet. 2008;371:9606. 10.1016/S0140-6736(08)60074-4. - PMC - PubMed
    1. Saigal S, Doyle LW. An overview of mortality and sequelae of preterm birth from infancy to adulthood. Lancet (London England). 2008;371:9608:261–9. 10.1016/s0140-6736(08)60136-1. - PubMed
    1. Khan KA, Petrou S, Dritsaki M, Johnson SJ, Manktelow B, Draper ES, Smith LK, Seaton SE, Marlow N, Dorling J, Field DJ, Boyle EM. Economic costs associated with moderate and late preterm birth: a prospective population-based study. BJOG: Int J Obstet Gynecol. 2015;122:11. 10.1111/1471-0528.13515. - PubMed
    1. Petrou S, Yiu HH, Kwon J. Economic consequences of preterm birth: a systematic review of the recent literature (2009–2017). Arch Dis Child. 2019;104:5456. 10.1136/archdischild-2018-315778. - PubMed

Publication types

Substances

LinkOut - more resources