. 2025 Apr 24;16(1):333.
doi: 10.1038/s41419-025-07660-7.

SOX5 inhibition overcomes PARP inhibitor resistance in BRCA-mutated breast and ovarian cancer

Affiliations

SOX5 inhibition overcomes PARP inhibitor resistance in BRCA-mutated breast and ovarian cancer

Mithun Ghosh et al. Cell Death Dis. .

Abstract

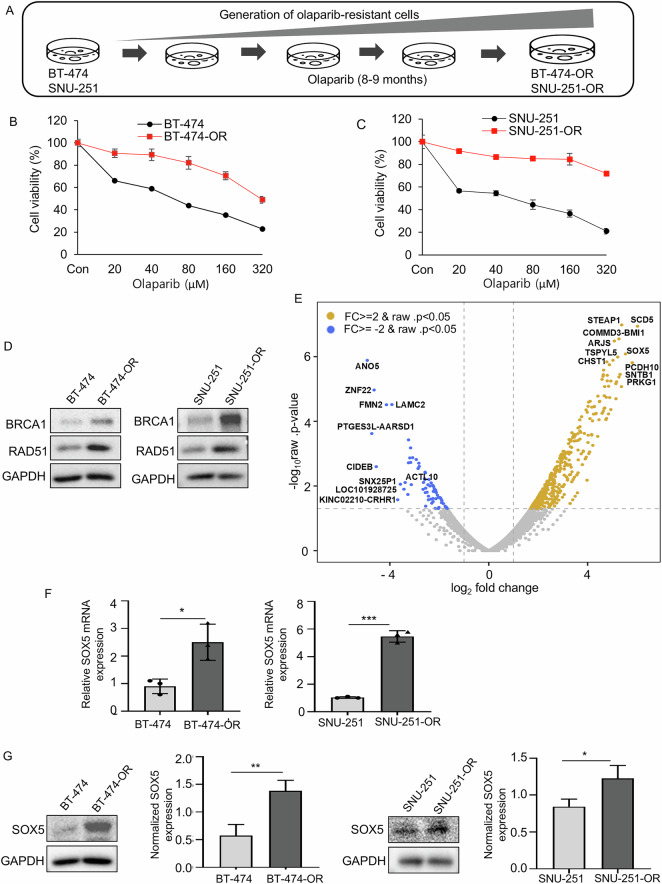
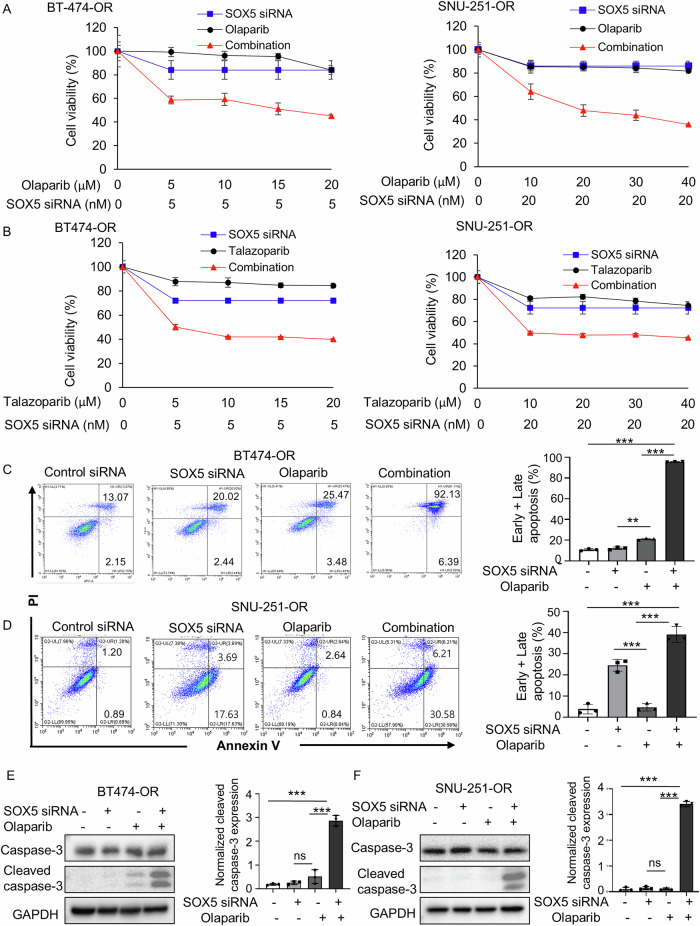
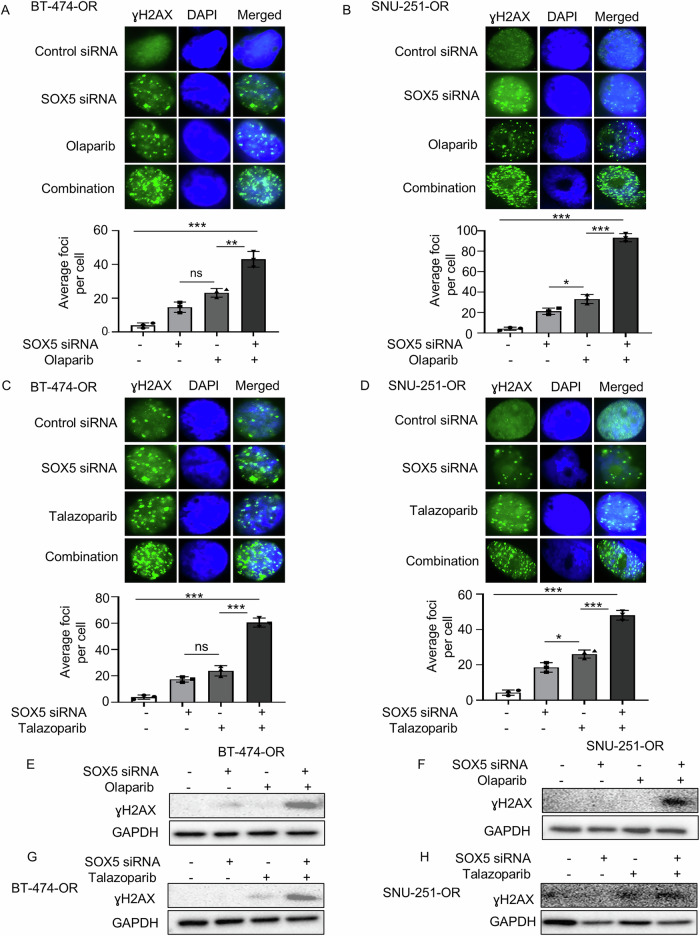
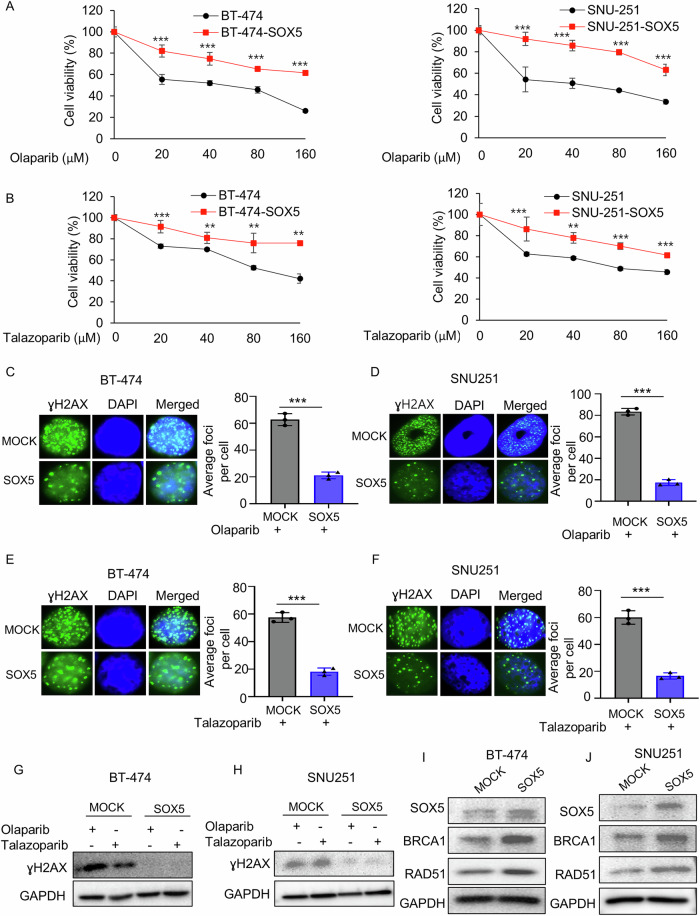
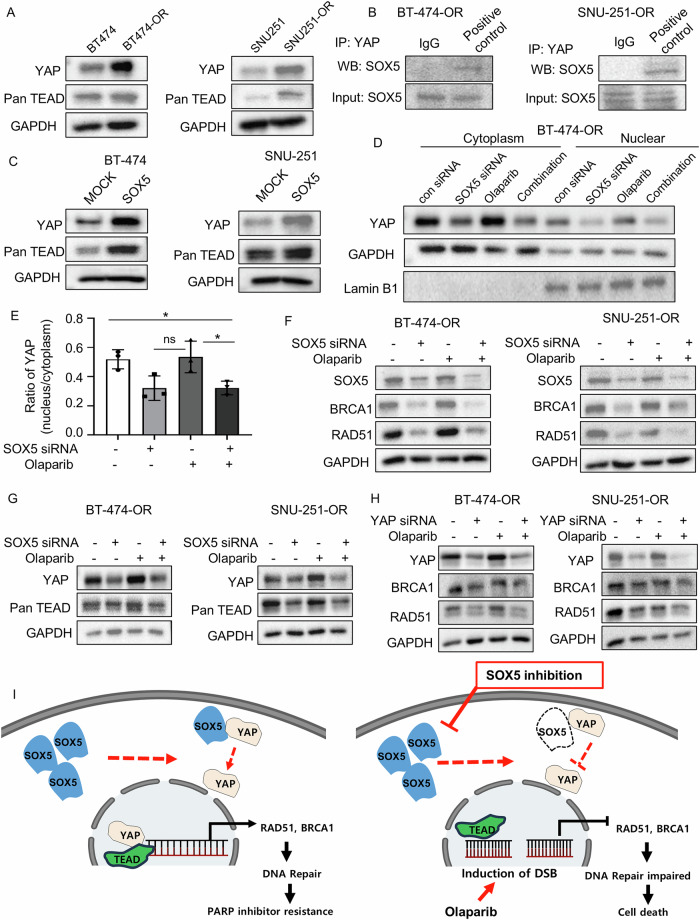
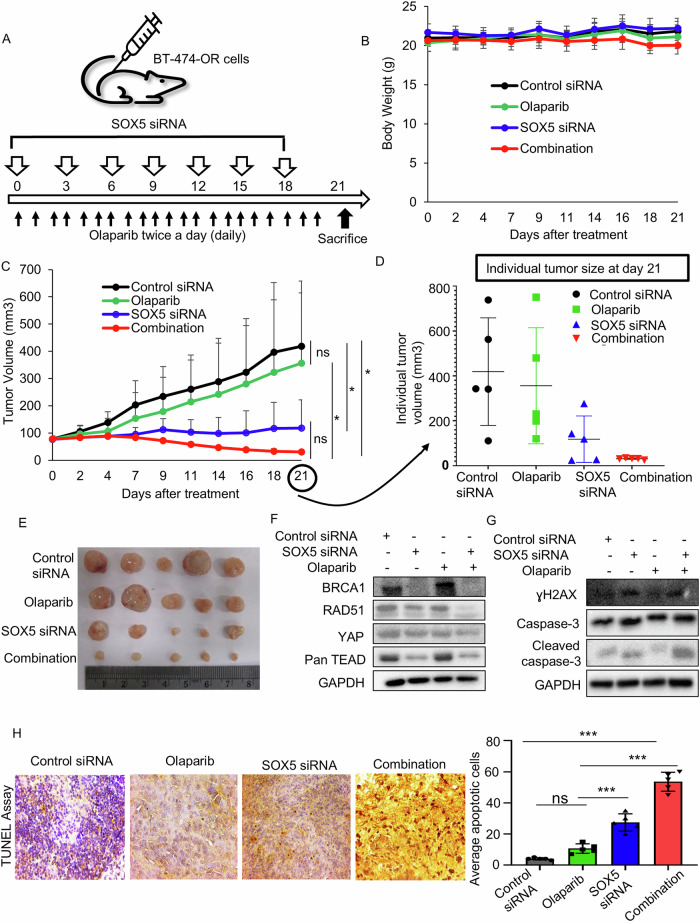
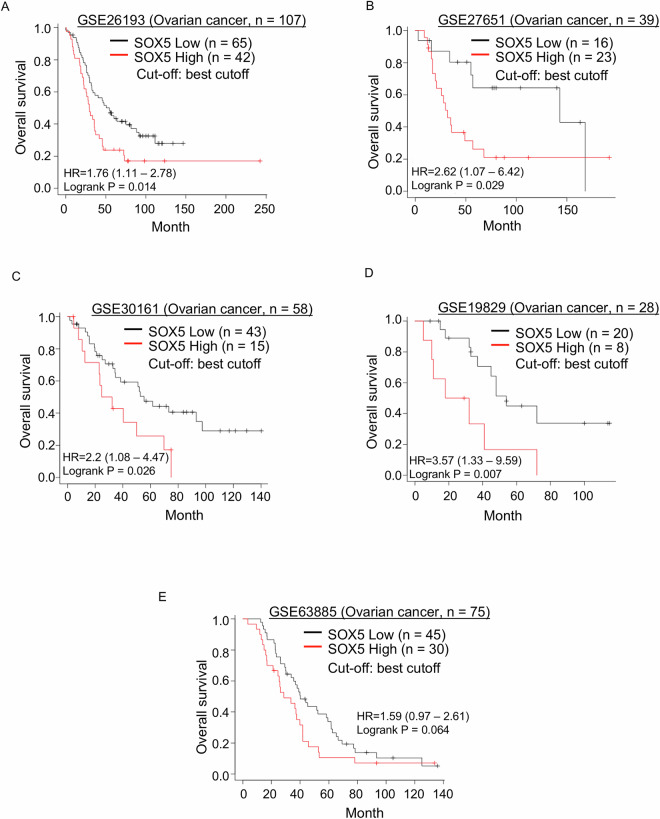
Poly (ADP-ribose) polymerase (PARP) inhibitors are effective in cells with homologous recombination (HR) deficiency, including BRCA1/2 mutation. However, PARP inhibitors remain a therapeutic challenge in breast and ovarian cancer due to inevitably acquired resistance in most cases. Therefore, strategies to overcome PARP inhibitor resistance are unmet clinical need. SRY-box transcription factor 5 (SOX5) plays a crucial role in development of various cancers but the role of SOX5 in PARP inhibitor resistance is poorly understood. This study identified SOX5 as a potential biomarker associated with PARP inhibitor resistance and addressed potential treatment strategies to overcome PARP inhibitor resistance using the olaparib-resistant preclinical model. We observed that SOX5 was significantly upregulated in olaparib-resistant cells and contributed to PARP inhibitor resistance by upregulating DNA repair pathway genes. Ectopic SOX5 overexpression contributed to PARP inhibitor resistance by suppressing DNA double-strand breaks (DSBs) in BRCA-mutated breast and ovarian cancer. SOX5 small interfering RNA combined with olaparib sensitized olaparib-resistant cells and suppressed the growth of olaparib-resistant xenografts in mice via increased DSBs represented by ɣH2AX formation. Mechanistically, SOX5 directly interacted with yes-associated protein 1 (YAP1) and promoted its nuclear translocation by suppressing the Hippo pathway. YAP1, in association with TEA domain family members (TEAD), upregulated HR-related gene expression and conferred PARP inhibitor resistance. Furthermore, the clinical relevance of SOX5 as a therapeutic target was supported by a significant association between SOX5 overexpression and poor prognosis in ovarian cancer on public mRNA microarray data sets. Therefore, we propose SOX5 as a promising therapeutic target for overcoming PARP inhibitor resistance in BRCA1/2-mutated breast and ovarian cancer.


Conflict of interest statement

Competing interests: The corresponding author received research funds from several pharmaceutical companies, including ImmunoMet Therapeutics, Hanmi Pharmaceutical Co., and Celltrion. The other authors declare no conflict of interest. Ethics: All animal procedures were performed according to the approved protocol by the Institutional Animal Care and Use Committee (IACUC) of CHA University (IACUC230054).

Figures

Fig. 1
Fig. 1. Generation and confirmation of olaparib-resistant cell lines and SOX5 is upregulated in olaparib-resistant cell.
A Schematic diagram of olaparib-resistant cell generation. BT-474 and SNU-251 cells were continuously treated with a gradually increasing concentration of olaparib for 8–9 months. The resistant cells were named BT-474-OR and SNU-251-OR. B, C Cell viability was measured by MTT assay in parental cells (BT-474, SNU-251) and olaparib-resistant cells (BT-474-OR, SNU-251-OR). Cells were treated with various concentrations of olaparib for 72 h. D Western blot analysis showed that expression of BRCA1 and RAD51 was upregulated in olaparib-resistant cells (BT-474-OR, SNU-251-OR) as compared to their respective parental cells (BT-474, SNU-251). E Volcano plot showed DEGs in BT-474-OR compared with BT-474 from RNA sequencing analysis. Blue indicated downregulated genes and light yellow indicated upregulated genes. FC, fold change. SOX5 was highly upregulated in BT-474-OR cells. F The relative mRNA expression was determined by qRT-PCR. SOX5 mRNA expression was upregulated in the olaparib-resistant cells (BT-474-OR, SNU-251-OR) as compared to parental cells (BT-474, SNU-251). Data were presented as mean ± SD of triplicate experiments. P values were calculated by Student’s t-test, indicating *p < 0.05, ***p < 0.001. G Western blot analysis exhibited the expression level of SOX5 in olaparib-resistant cells (BT-474-OR, SNU-251-OR) cells versus parental cells (BT-474, SNU-251). SOX5 was significantly upregulated in olaparib-resistant cells as compared to parental cells. Bar graphs exhibited normalized SOX5 expressions from 3 independent experiments. SOX5 expression was normalized with GAPDH. Data were presented as mean ± SD from 3 independent experiments. P values were calculated by Student’s t-test, indicating *p < 0.05, **p < 0.01. GAPDH was used as loading control.
Fig. 2
Fig. 2. SOX5 inhibition synergizes with olaparib (or talazoparib) in olaparib-resistant cell.
A, B Cell viability (MTT) assay of BT-474-OR and SNU-251-OR cells. Cells were treated with SOX5 siRNA, various concentrations of olaparib (or talazoparib) and their combination and incubated for 72 h. C, D Apoptosis assay conducted by flow cytometry. Representative scatter plots of PI (y-axis) and annexin V (x-axis) are shown. Cells were treated with SOX5 siRNA (5 nmol in BT474-OR and 20 nmol in SNU-251-OR), olaparib (10 µM) and their combination for 72 h. The bar graphs depicted the average of total apoptotic cells of 3 independent experiments. P values were calculated by Student’s t-test, indicating **p < 0.01, ***p < 0.001. Data are presented as mean ± SD from 3 independent experiments. E, F Western blot analysis showed the expressions of apoptosis marker, caspase-3, and cleaved caspase-3. Cells were treated with SOX5 siRNA (5 nmol in BT474-OR and 20 nmol in SNU-251-OR), olaparib (5 µM) and their combination for 72 h. The bar graphs showed the normalized expression of cleaved caspase-3 based on densitometric analysis from 3 independent experiments. P values were calculated by Student’s t-test, indicating ***p < 0.001. ns, not significant. Data are presented as mean ± SD from 3 independent experiments. GAPDH was used as a loading control.
Fig. 3
Fig. 3. Increased DNA double strand-break could be the reason for synergistic effects between SOX5 inhibition and olaparib (or talazoparib).
AD Immunofluorescence images showed the ɣH2AX foci formation in BT-474-OR and SNU-251-OR cells. Cells were treated with SOX5 siRNA (5 nmol in BT474-OR and 20 nmol in SNU-251-OR) and 5 µM of olaparib (or talazoparib, 5 µM) and their combination for 72 h. The images were taken at 100x magnification. The bar graphs depicted the average foci number per cell. Data were averaged from three independent experiments, with 100 cells analyzed per condition in each experiment. Data are presented as mean ± SD. P values were calculated by Student’s t-test, indicating *p < 0.05, **p < 0.01, ***p < 0.001. ns, not significant. EH The expression of ɣH2AX was evaluated by western blot analysis in BT-474-OR and SNU-251-OR cells. Cells were treated with SOX5 siRNA (5 nmol in BT474-OR and 20 nmol in SNU-251-OR), 5 µM of olaparib (or talazoparib, 5 µM) and their combination for 72 h. GAPDH was used as loading control.
Fig. 4
Fig. 4. Ectopic overexpression of SOX5 leads to PARP inhibitor resistance.
A, B MTT assay was used to measure the cell viability of BT-474 and SNU-251 cells before and after the ectopic overexpression of SOX5. Cells were treated with the indicated concentrations of olaparib or talazoparib for 72 h. Data shown here were the representative of 3 independent experiments. P values were calculated by Student’s t-test, indicating **p < 0.01, ***p < 0.001. CF ɣH2AX foci were determined by Immunofluorescence assay in BT-474, SNU-251 parental cells and ectopically SOX5-overexpressed cells. Cells were treated with 5 µM of olaparib (or talazoparib, 5 µM) and incubated for 72 h. The images were taken at 100x magnification. The bar graphs depicted the average foci number per cell. Data were averaged from three independent experiments, with 100 cells analyzed per condition in each experiment. Data are presented as mean ± SD. P values were calculated by Student’s t-test, indicating ***p < 0.001. G, H Western blot analysis was carried out to determine the expression of ɣH2AX in BT-474, SNU-251 parental cells and ectopically SOX5-overexpressed cells. Cells were treated with olaparib (5 µM) and talazoparib (5 µM) for 72 h. GAPDH was used as loading control. I, J Western blot analysis showed that expression of BRCA1 and RAD51 was increased in SOX5-overexpressed cells. GAPDH was used as loading control.
Fig. 5
Fig. 5. SOX5 inhibition attenuates HR repair signaling via the Hippo-YAP pathway.
A Western blot analysis showed expression of YAP and pan-TEAD in parental versus olaparib-resistant cell. GAPDH was used as loading control. B The complex formation of YAP and SOX5 was analyzed by co-immunoprecipitation assay. C Western blot analysis showed expression of YAP and pan-TEAD in BT-474 and SNU-251 cells with and without ectopically overexpression of SOX5. GAPDH was used as loading control. D, E Western blot analysis showed YAP expression in the cytoplasm and nuclear fraction of BT-474-OR cells treated with SOX5 siRNA, olaparib, and their combination for 72 h. GAPDH and Lamin B1 was used as loading control. Bar graphs exhibited a ratio (nuclear/cytoplasmic) of YAP intensities from 3 independent experiments. Data are presented as mean ± SD. P values were calculated by Student’s t-test, indicating *p < 0.05, ns, not significant. F Western blot analysis showed expression of BRCA1 and RAD51 in olaparib-resistant cells treated with SOX5 siRNA, olaparib, and their combination for 72 h. GAPDH was used as loading control. G Western blot analysis showed the expression of YAP and pan-TEAD in olaparib-resistant cells after treatment with SOX5 siRNA, olaparib, and their combination for 72 h. GAPDH was used as loading control. H Western blot analysis showed the expression of BRCA1 and RAD51 in olaparib-resistant cells after treatment with YAP siRNA, olaparib and their combination for 72 h. GAPDH was used as loading control. I Schematic diagram showing the proposed mechanism that explains how SOX5 is associated with PARP inhibitor resistance. Briefly (left panel), in the olaparib-resistant cells SOX5 is upregulated in the olaparib-resistant cells, where SOX5 interacts with YAP. Then YAP is translocated into the nucleus, transcribing HR repair genes (BRCA1 and RAD51) and consequently PARP inhibitor resistance occurs. On the contrary, (right panel) when SOX5 is inhibited in the presence of PARP inhibitors, nuclear translocation of YAP is suppressed. Subsequently, transcription of HR repair genes (BRCA1 and RAD51) is attenuated, resulting in profound DNA DSBs and cell death.
Fig. 6
Fig. 6. Combined SOX5 siRNA and olaparib regresses the olaparib-resistant breast cancer synergistically in a xenograft model.
A Schematic view of in vivo efficacy experiment in acquired olaparib-resistant xenograft model using BT-474-OR cells. When tumor reached 70–80 mm3, mice were randomized to control siRNA (n = 5), olaparib (n = 5), SOX5 siRNA (n = 5) and combination (n = 5) treatment groups. Control siRNA and SOX5 siRNA were administered intratumorally every 3 days for 7 times. Olaparib was administered by oral gavage twice daily for 21 days. B Average body weight of each treatment group. Error bars represent the SD of 5 mice per group. C Mean tumor growth inhibition curves in mice treated with indicated drugs. Error bars represent the SD of 5 mice per group. Indicated p values were calculated by Student’s t-test, indicating *p < 0.05. ns, not significant. D Individual tumor volumes were shown on day 21 of treatment initiation. Data were presented as the mean ± SD. E Photo of the excised tumors of each treatment group shown after sacrificing on day21. F Western blot using xenograft tumors after 21 days of treatment initiation. Combination treatment suppressed the expressions of BRCA1, RAD51, YAP and pan-TEAD more than did olaparib alone. G Western blot using xenograft tumors after 21 days of treatment initiation. The expressions of DNA damage marker (ɣH2AX) and apoptosis marker (cleaved caspase-3) were more increased after combination treatment than monotherapy. H TUNEL assay using xenograft tumors. Staining images of each group are shown, and bar graph represented average apoptotic cells in each group in five random, non-overlapping fields at 400x magnification. Data are presented as mean ± SD. Indicated p values were calculated by Student’s t-test, indicating ***p < 0.001. ns, not significant.
Fig. 7
Fig. 7. High SOX5 expression is associated with poor prognosis in ovarian cancer.
AE Kaplan–Meier survival curve of OS in ovarian cancer according to relative SOX5 mRNA expression, and the data were analyzed using online platform Kaplan–Meier plotter (https://kmplot.com/analysis/). SOX5 mRNA expression levels were divided into two groups, “SOX5-High” and “SOX5-Low,” with the auto-select best cutoff.

Similar articles

Cited by

References

    1. Moynahan ME, Jasin M. Mitotic homologous recombination maintains genomic stability and suppresses tumorigenesis. Na Rev Mol Cell Biol. 2010;11:196–207. - PMC - PubMed
    1. O’Connor MJ. Targeting the DNA damage response in cancer. Mol Cell. 2015;60:547–60. - PubMed
    1. Network CGAR. Integrated genomic analyses of ovarian carcinoma. Nature. 2011;474:609. - PMC - PubMed
    1. Armstrong N, Ryder S, Forbes C, Ross J, Quek RGA. systematic review of the international prevalence of BRCA mutation in breast cancer. Clin Epidemiol. 2019;11:543–61. - PMC - PubMed
    1. Lang SH, Swift SL, White H, Misso K, Kleijnen J, Quek RG. A systematic review of the prevalence of DNA damage response gene mutations in prostate cancer. Int J Oncol. 2019;55:597–616. - PMC - PubMed

MeSH terms