. 2025 Apr 24;16(1):3844.
doi: 10.1038/s41467-025-59283-3.

Coxiella burnetii manipulates the lysosomal protease cathepsin B to facilitate intracellular success

Affiliations

Coxiella burnetii manipulates the lysosomal protease cathepsin B to facilitate intracellular success

Lauren E Bird et al. Nat Commun. .

Abstract

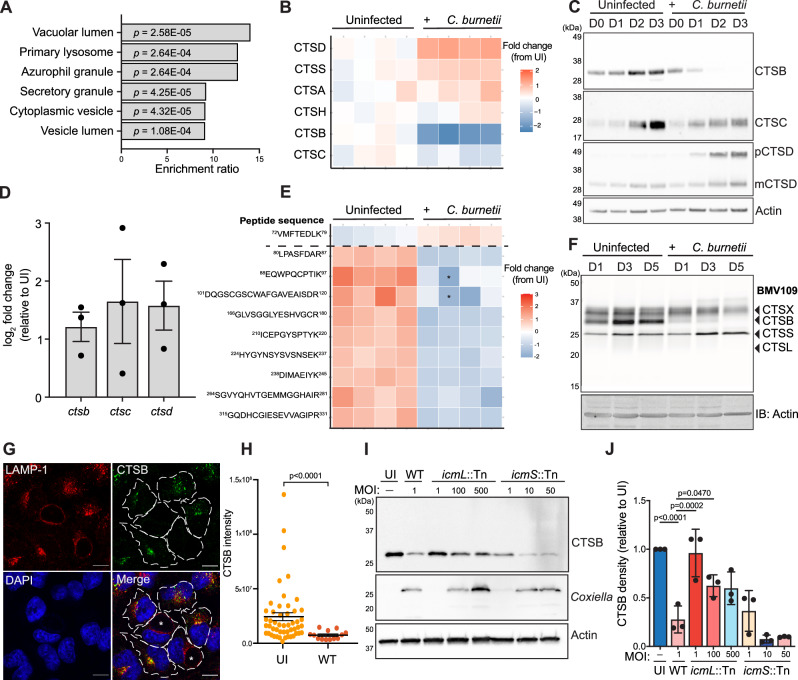
The obligate intracellular bacterium Coxiella burnetii establishes an intracellular replicative niche termed the Coxiella-containing vacuole (CCV), which has been characterised as a bacterially modified phagolysosome. How C. burnetii withstands the acidic and degradative properties of this compartment is not well understood. We demonstrate that the key lysosomal protease cathepsin B is actively and selectively removed from C. burnetii-infected cells through a mechanism involving the Dot/Icm type IV-B secretion system effector CvpB. Overexpression of cathepsin B leads to defects in CCV biogenesis and bacterial replication, indicating that removal of this protein represents a strategy to reduce the hostility of the intracellular niche. In addition, we show that C. burnetii infection of mammalian cells induces the secretion of a wider cohort of lysosomal proteins, including cathepsin B, to the extracellular milieu via a mechanism dependent on retrograde traffic. This study reveals that C. burnetii is actively modulating the hydrolase cohort of its replicative niche to promote intracellular success and demonstrates that infection incites the secretory pathway to maintain lysosomal homoeostasis.


Conflict of interest statement

Competing interests: The authors declare no competing interests.

Figures

Fig. 1
Fig. 1. Altered abundance and activity of lysosomal proteases during C. burnetii infection.
A, B THP-1 cells were uninfected (n = 4) or infected (n = 4) with C. burnetii (MOI 50) for 72 h prior to sample collection for mass spectrometry. A Gene ontology (GO) on significantly enriched proteins. GO analysis was performed using WebGestalt overrepresentation test and the cellular component functional database. P-values calculated using Fisher’s exact test with BH correction for multiple comparisons. B Heat map of LFQ intensities of protein abundance for all cathepsins identified. Each column represents one biological replicate. C Immunoblot showing cathepsin expression over 3 days in uninfected or C. burnetii-infected THP-1 lysates. D qRT-PCR analysis of transcript abundance for cathepsin B, C, and D in uninfected or infected THP-1 cells after 72 h of infection. Raw values were normalised against 18S rRNA transcript abundance and are presented as normalised log2 fold change from UI. Data reflect 3 biological replicates, error bars represent SEM. E Heatmap of cathepsin B peptides observed from DIA proteomic analysis of 72 h THP-1 infected cells. Peptides are ordered from N-terminus (top) to C-terminus (bottom), with horizontal dashed line indicating cleavage site at end of pro-domain. Imputed values denoted with an asterisk. F BMV109 labelling of active cysteine proteases at D1, 3, or 5 post infection. Gel is representative of 3 independent experiments. G Representative image of HeLa cells infected with C. burnetii (MOI 1) for 72 h and stained with antibodies against LAMP-1 and cathepsin B. Infected cells were identified by LAMP-1 staining and are denoted with an asterisk. H Quantification of imaging in G. Data points represent individual cells measured within one experiment (UI, n = 50, WT, n = 13). Error bars represent mean + SEM (I, J) Immunoblot of THP-1 cells infected with wild-type C. burnetii (WT), icmL::Tn or icmS::Tn mutants at the indicated MOI. Blot is representative of three independent experiments (quantified in J). Error bars reflect SD. CTSB cathepsin B, CTSC cathepsin C, pCTSD pro-cathepsin D, mCTSD mature cathepsin D; Scale bar = 10 μm. Source data are provided as a Source Data file. Mass spectrometry source data are available via ProteomeXchange with identifier PXD052888.
Fig. 2
Fig. 2. Overexpression of cathepsin B is detrimental to C. burnetii replication and CCV biogenesis.
A Schematic depiction of cathepsin B-GFP domains and processing events. Catalytic cysteine is indicated above with black arrowhead. SP signal peptide, Pro pro-domain (B) HeLa cells or HeLa cells expressing GFP only, cathepsin B-GFP (CTSB-GFP) or catalytically inactive cathepsin B-GFP (CTSBC108A-GFP) were labelled with BMV109 for 3 h prior to analysis of in-gel fluorescence (top) or immunoblotting for total cathepsin B (middle). Ponceau was used as a loading control (bottom). Pro pro-domain, SC single chain, HC heavy chain (CF) HeLa, GFP, CTSB-GFP, or CTSBC108A-GFP cells were uninfected or infected with C. burnetii at a MOI of 5. After 72 h, cells were harvested for immunoblotting (C), quantitative PCR (D), or fixed for immunofluorescence microscopy (E, F). D To quantify bacterial intracellular replication, cells were harvested immediately following infection (D0), or at days 1, 3, 5, and 7 post-infection, genomic DNA was extracted, and C. burnetii genome equivalents quantified via qPCR with C. burnetii specific primers. Error bars represent standard deviation of six independent experiments that are represented by individual symbols. P values calculated by two-way ANOVA with Dunnett’s correction for multiple comparisons. E Representative images of those used for quantification in F. F Quantification of CCV area as determined by ImageJ analysis of confocal images. Top panel, data points reflect average CCV area for each replicate, n = 3. For each replicate, >100 CCVs were measured and quantified. Statistical significance was determined using one-way ANOVA and comparing each group to CTSB-GFP. Error bars represent SD. Bottom panel, representation of spread of CCV areas from one replicate. Black line denotes mean. Scale bar = 10 μm. Source data are provided as a Source Data file.
Fig. 3
Fig. 3. Loss of cathepsin B during C. burnetii infection requires the T4SS effector CvpB.
A Immunoblot of THP-1 cells uninfected (UI) or infected with C. burnetii wild-type (WT), cvpB::Tn or cvpB::Tn(pFLAG-cvpB) at MOI 25 for 72 h. Blot is representative of 3 independent experiments, quantified in B. Error bars denote SD. C Representative image of HeLa cells infected with the above strains and stained with antibodies against cathepsin B and LAMP-1. Scale bar = 10 μm. Dashed lines denote cell periphery of uninfected cells, solid lines, infected cells. CCVs indicated with an asterisk. D Quantification of CTSB signal intensity in C. Individual data points are from two independent experiments, coloured in black or grey, respectively. WT n = 25, cvpB::Tn n = 32, cvpB::Tn(pFLAG-cvpB) n = 27. Statistical significance determined using Kruskal–Wallis test. Data are presented as mean (column height), error bars represent SD. E Cathepsin B label-free quantification (LFQ) values from THP-1 cells infected with WT, cvpB::Tn, or cvpB::Tn (pFLAG-cvpB) (n = 3, MOI 50) for 72 h. Statistical significance was calculated using one-way ANOVA with Tukey’s correction. Data are presented as mean (column height), error bars reflect SD. F BMV109 labelling (top) or immunoblot (bottom) on THP-1 cells infected with WT, cvpB::Tn or cvpB::Tn (pFLAG-cvpB) for 72 h (MOI 25). G Schematic depicting experimental design of data presented in H. H Analysis of bacterial intracellular replication in THP-1 cells infected with the indicated strains in the presence of DMSO or 10 μM Ca074Me. Data are presented as fold change relative to D0, with individual data points representing the mean of three biological replicates. Error bars denote SD. Statistical significance was examined using a paired t-test of each condition ± Ca074Me. IK HeLa cells were transfected with pcDNA-3xFLAG-cvpB or pcDNA-3xFLAG for 18 h before immunofluorescence microscopy using antibodies against CTSB or FLAG. Scale bar = 10 μm. J Quantification of co-localisation in I. Area quantified is indicated in I by white line. K CTSB intensity in HeLa cells expressing 3xFLAG or 3xFLAG-CvpB. Data reflect the mean of three independent experiments (3xFLAG n = 70, 3xFLAG-CvpB n = 108). Statistical significance was examined using an unpaired t-test, error bars reflect SD. Source data are provided as a Source Data file. Mass spectrometry source data are available via ProteomeXchange with identifier PXD052954.
Fig. 4
Fig. 4. C. burnetii infection leads to the secretion of lysosomal content.
A Immunoblot on whole cell lysates (lysate) or conditioned media (media) from uninfected or C. burnetii-infected HeLa cells. Cells were infected for 48 h (MOI 100) before being changed to serum-free media for a further 16 h. Blot is representative of 3 independent experiments, quantified in B Error bars denote SD. CI Conditioned media from uninfected (n = 4) or C. burnetii-infected (n = 4) THP-1 cells (C, D, G) or HeLa cells (E, F) were subject to label-free quantitative mass spectrometry. C Heatmap of MaxLFQ expression of peptides from cathepsin B, ordered from N-terminus (top) to C-terminus (bottom). Horizontal dashed line depicts end of pro-domain. Columns represent individual biological replicates. D, E Scatter plot of proteins enriched in the supernatant of C. burnetii-infected cells, where X-axis represents fold change (infected/uninfected) and Y-axis shows statistical significance as determined by a student’s t test. Proteins identified as located in the lysosome, lysosome lumen, or lysosome membrane (GO terms GO:0005764, GO:0043202, or GO:0005765, respectively) are coloured; all other proteins identified are depicted in grey. Horizontal dashed line denotes significance cut off (p < 0.05), vertical dashed line represents fold change > 1. Lysosomal proteins within these bounds are labelled with gene names. F, G GO analysis on significantly enriched proteins in D, E performed using WebGestalt overrepresentation test (Fisher’s exact test with BH correction for multiple comparisons) and the cellular component functional database. H Venn diagram depicting overlap of significantly enriched proteins in the supernatant from THP-1 and HeLa cells. I Proteins identified as significantly enriched in the supernatant of infected THP-1 and HeLa cells. Significance was determined using a student’s t test −log(p value) > 1.3 and log2 fold change > 1. Localisation is presented as designated in UniProt. Source data are provided as a Source Data file. Proteomics data have been deposited in ProteomeXchange with identifiers PXD052888 (THP-1) and PXD052890 (HeLa).
Fig. 5
Fig. 5. Secretion of lysosomal content is independent of CvpB and involves the default secretory pathway.
A, B Immunoblot on THP-1 lysates or media following infection with WT or cvpB::Tn. Blot is representative of 3 independent experiments, quantified in B. Statistical significance was determined by one-way ANOVA with Tukey’s correction. Error bars denote SD. C Scatter plot of proteins enriched in the supernatant of cvpB::Tn (n = 4) or cvpB::Tn(pFLAG-cvpB) (n = 3) as determined by proteomics analysis. X-axis represents fold change (relative to WT), Y-axis shows statistical significance as determined by Student’s t test. Proteins located in the lysosome, lysosome lumen, or lysosome membrane (GO terms GO:0005764, GO:0043202, or GO:0005765, respectively) are coloured; all other proteins identified are depicted in grey. Horizontal dashed line denotes significance (p < 0.05), vertical dashed line represents fold change >1. Lysosomal proteins within these bounds are labelled. D Immunoblot on THP-1 lysates or media following infection with WT or icmL::Tn at the indicated MOI. Blot is representative of 3 independent experiments, quantified in E. Mean is represented by column height, error bars represent SD. Statistical significance was determined using one-way ANOVA with Tukey’s correction. F qPCR determination of C. burnetii genome equivalents after 48 h of infection followed by 6 h treatment with DMSO (n = 4) or 1 μM brefeldin A (BFA) (n = 4). Statistical significance was examined using an unpaired t-test. Error bars denote SD. G, H THP-1 cells were treated with BFA as in F for 6 h before conditioned media and lysate fractions were collected for immunoblotting. Data reflect three biological replicates, error bars denote SD. I Schematic of experimental design for data presented in J. J THP-1 cells were uninfected (mock, n = 3) or infected with WT (n = 3) for 72 h before the secretomes were collected and applied to naïve cells for 24 h. After this time, treated cells were infected and harvested for qPCR analysis at D0, 1, and 3 post infection. Data points represent the mean of three biological replicates. Statistical significance was examined using an unpaired t-test at D3 post-infection. Error bars denote standard deviation. All source data are provided as a Source Data file. Mass spectrometry data have been deposited in ProteomeXchange with identifier PXD052954.
Fig. 6
Fig. 6. C. burnetii subverts the host lysosome and trafficking pathways to facilitate intracellular success.
Proposed model for the response of mammalian cells to infection with WT or cvpB::Tn C. burnetii. Infection with both strains leads to secretion of a cohort of lysosomal proteins to the extracellular space through a mechanism that can be inhibited with BFA. Infection with WT, but not cvpB::Tn leads to removal of cathepsin B (CTSB) from the Coxiella-containing vacuole (CCV). Figure created in BioRender. Bird, L. (2025) https://BioRender.com/c7kaafo.

References

    1. Cocchiaro, P. et al. The multifaceted role of the lysosomal protease cathepsins in kidney disease. Front. Cell Dev. Biol.5, 114 (2017). - PMC - PubMed
    1. Wang, X. & Robbins, J. Proteasomal and lysosomal protein degradation and heart disease. J. Mol. Cell. Cardiol.71, 16–24 (2014). - PMC - PubMed
    1. Müller, S., Dennemärker, J. & Reinheckel, T. Specific functions of lysosomal proteases in endocytic and autophagic pathways. Biochim. Et. Biophys. Acta Proteins Proteom.1824, 34–43 (2012). - PMC - PubMed
    1. Turk, V. et al. Cysteine cathepsins: From structure, function and regulation to new frontiers. Biochim. Et. Biophys. Acta Proteins Proteom.1824, 68–88 (2012). - PMC - PubMed
    1. Bird, L. E., Edgington-Mitchell, L. E. & Newton, H. J. Eat, prey, love: pathogen-mediated subversion of lysosomal biology. Curr. Opin. Immun.83, 102344 (2023). - PubMed

LinkOut - more resources