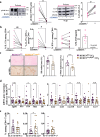
. 2025 Apr 24;16(1):3860.
doi: 10.1038/s41467-025-59218-y.

Defective autophagy in CD4 T cells drives liver fibrosis via type 3 inflammation

Affiliations

Defective autophagy in CD4 T cells drives liver fibrosis via type 3 inflammation

Rola Al Sayegh et al. Nat Commun. .

Abstract

Conventional CD4 T cells represent a major source of inflammatory mediators that drive progression of chronic liver disease to fibrosis and to end-stage cirrhosis. Identification of T cell pathways that limits the inflammatory response could thus have therapeutic relevance. Here we show, using both human samples and mouse models, that autophagy is deficient in CD4 T cells from patients with advanced fibrosis, and that loss of autophagy following genomic deletion of ATG5 in T cells is associated with the emergence of pathogenic IL-17A + IFN-γ + Th17 T cells that drive liver fibrosis in mice. Mechanistically, liver CD4 T cells lacking autophagy display a Th17 glycolytic phenotype associated with enhanced type 3 cytokine (i.e., IL-17A and GM-CSF) release, shifting hepatic myofibroblasts, hepatocytes and macrophages toward a proinflammatory phenotype. We also show that autophagy can be rescued in CD4 T cells from patients with extensive liver fibrosis, leading to decreased frequency of pathogenic Th17 cells and reduced GM-CSF levels; in addition, limited fibrosis is observed in mice in which Rubicon, a negative regulator of autophagy, is deleted specifically in their T cells. Our findings thus implicate autophagy in CD4 T cells as a key therapeutic target to control inflammation-driven fibrosis during chronic liver injury.


Conflict of interest statement

Competing interests: The authors declare no competing interests.

Figures
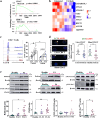
Fig. 1
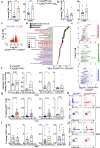
Fig. 1. Patients with extended fibrosis/cirrhosis show defective autophagy in CD4 T cells.
a GSEA from publicly available single-cell data of autophagy pathway genes in CD4 and CD8 T cells subsets from healthy and cirrhotic human livers (n = 5 individuals/group) (b) Heatmap of pseudo-bulk autophagic gene expression from the leading edge of the GSEA graph of the CD4 T subset. c Representative histograms and Geometric Mean Fluorescence Intensity (geoMFI) of LC3II + CD4 T cells in human intrahepatic leukocytes from patients with extended fibrosis/cirrhosis (F3-F4, METAVIR score) (n = 5) and controls (n = 8), incubated with 30 μM chloroquine (CQ) or vehicle (#p = 0.0156 by two-tailed Wilcoxon matched-pairs signed rank test and *p = 0.0186 by two-tailed Mann–Whitney test). d Representative confocal immunofluorescent images and percentage of LC3 (green) colocalized with LAMP1 (red) over total LC3 in CD4 T cells from liver (n = 9/group) and blood isolated from patients with extended fibrosis/cirrhosis (n = 13) compared to controls (n = 12) *p = 0.037. Scale bar is 1.99 μm. e Representative western blot analysis and quantification normalized to β-actin of autophagy-related proteins in CD4 T cells from blood of healthy and patients with mild or extended fibrosis/cirrhosis. Results are expressed as a fold over healthy except for pULK1 Ser757 (n = 12 healthy, n = 8 F1-F2, n = 16 F3-F4 and *p = 0.049 for Rubicon; n = 11 healthy, n = 8 F1-F2, n = 14 F3-F4 and **p = 0.005 for P62; n = 15 healthy, n = 8 F1-F2, n = 10 F3-F4 for ATG5-ATG12; n = 9 healthy, n = 10 F3-F4 and *p = 0.026 for pULK Ser757). (d-e) Data are mean ± S.E.M. Statistical analysis was performed by (a) GSEA (d) two-tailed Mann–Whitney for liver CD4 samples and (de) two-tailed univariate analysis for blood samples in which age of controls and patients differed statistically. Each variable achieving a p-value < 0.05 (i.e., only Rubicon) was then introduced into a two-tailed bivariate model (Table S2). Source data are provided as a Source Data file.
Fig. 2
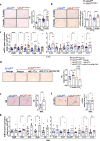
Fig. 2. Hepatic T cell immune profiling reveals a shift toward a pathogenic Th17 phenotype in ATG5TLymph-/- fibrotic mice.
Mice were (ag) injected CCl4 for 5 weeks or (h) subjected to BDL. a, b Flow cytometry analysis of activation markers CD25 (n = 7 ATG5fl/fl and n = 6 ATG5Tlymph-/- mice) and CD69 (n = 8 ATG5fl/fl and n = 4 ATG5Tlymph-/- mice) among (a) CD4+ **p = 0.0012 for CD25 and **p = 0.0081 for CD69 and (b) CD8 + T cells. ce RNA-seq analysis of purified CD4 + T cells isolated from CCl4-injected mice (n = 5 ATG5fl/fl and n = 6 ATG5Tlymph-/- mice). c Volcano plot indicating number of significantly up- and down-regulated genes (adj p ≤ 0.05). d Top KEGG pathways significantly enriched in ATG5TLymph-/- compared to ATG5fl/fl CD4 T cells. KEGG pathways are ordered by NES. e Selected genes significantly upregulated in ATG5TLymph-/- compared to ATG5fl/fl CD4 T cells. f Absolute numbers of non-pathogenic (IL-17A + IFN-γ- and IL−17A + IL-22 + , *p = 0.0478), pathogenic Th17 (IL-17A + IFN-γ+, *p = 0.0344), and GM-CSF+ among CD4 + T cells (n = 7 mice/group) in CCl4 injected mice. gj Frequencies and dot plots of non-pathogenic and pathogenic Th17 among CD4 + T cells in (gh) CCl4 model (n = 23 ATG5fl/fl and n = 22 ATG5Tlymph-/- mice, pooled data from 4 experiments, ****p < 0.0001 for IL-17A + IFN-γ- and IL-17A + IFN-γ+; n = 13 ATG5fl/fl and n = 14 ATG5Tlymph-/- mice, pooled data from 2 experiments, **p = 0.0045 for IL-17A + IL-22+ and n = 7 mice/group, ***p = 0.0006 for GM-CSF + ) and (i-j) BDL model (n = 10 ATG5fl/fl and n = 9 ATG5Tlymph-/- mice for IL-17A + IFN-γ-, IL-17A + IFN-γ + *p = 0.0289 and GM-CSF+ *p = 0.0295, pooled data from 3 experiments and n = 6 mice/group for IL-17A + IL-22 + , pooled data from 2 experiments). a, b, f, g, i Data are mean ± S.E.M. Statistical analysis was performed by (a, f, g, i) two-tailed Mann–Whitney, (c, e) DESeq2 and p-values were adjusted using the Benjamini & Hochberg method (d) GSEA and p-values were adjusted using Benjamini-Hochberg method. Source data are provided as a Source Data file.
Fig. 3
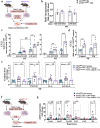
Fig. 3. Autophagy deletion in T cells exacerbates liver fibrosis in mice.
a, b Representative images and quantification of (a) Sirius red (SR) (b) α-SMA-positive areas in liver tissue sections from ATG5fl/fl and ATG5TLymph-/- mice injected CCl4 for 2 (n = 5 ATG5fl/fl and n = 6 ATG5Tlymph-/- mice, **p = 0.0087 for SR and *p = 0.0455 for α-SMA) or 5 weeks (n = 21 ATG5fl/fl and n = 22 ATG5Tlymph-/- mice for SR, pooled data from 3 experiments (***p = 0.0006 ATG5fl/fl 2 weeks vs ATG5fl/fl 5 weeks and ***p = 0.0002 ATG5fl/fl vs ATG5TLymph-/-) and n = 13 ATG5fl/fl and n = 9 ATG5Tlymph-/- mice for α-SMA, pooled data from 2 experiments, **p = 0.0035). c Hepatic gene expression of inflammatory cytokines, chemokines and chemokine receptors from CCl4-injected mice for 5 weeks (n = 13 mice/group, pooled data from 2 experiments, ***p = 0.0006 Tgfb1, *p = 0.0399 Il1a, *p = 0.0158 Il1b, *p = 0.0140 Tnfa, *p = 0.0440 Ccr5). d Representative images and quantification of SR of liver sections from ATG5TLymph-/- mice injected for 2 weeks with CCl4+ isotypes, CCl4+ anti-IL-17A alone or CCl4+ anti-IL-17A and anti-GM-CSF (n = 11 for ATG5fl/fl+isotype, n = 12 for ATG5Tlymph-/-+isotype and n = 7 for ATG5Tlymph-/-+αIL-17A and ATG5Tlymph-/-+αIL-17A + αGM-CSF, *p = 0.0255, **p = 0.0016, ****p < 0.0001). e, f Representative images and quantification of (e) SR and (f) α-SMA-positive areas in liver tissue sections from mice subjected to BDL (*p = 0.0435, **p = 0.0057). g Hepatic gene expression of inflammatory cytokines, chemokines and chemokine receptors from BDL mice (*p = 0.0207 Il1a, **p = 0.0094 Il1b, *p = 0.0182 Tnfa, *p = 0.0329 Ccl3, *p = 0.0295 Ccr2). eg n = 10 ATG5fl/fl and n = 9 ATG5Tlymph-/- mice. Scale bar is 100 μm. Data are mean ± S.E.M. Statistical analysis was performed by two-tailed Mann-Whitney. Source data are provided as a Source Data file.
Fig. 4
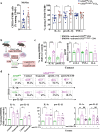
Fig. 4. Autophagy-deficient CD4 T cells enhance the inflammatory properties of hepatic myofibroblasts (MF) and hepatocytes.
a Experimental co-culture protocol of MF with either non-activated or activated spleen ATG5TLymph-/- or WT CD4 T cells (b) BrdU incorporation in hepatic MF following direct co-cultures with n = 4 non-activated or activated CD4 T cell preparations. ce ELIZA quantification of cytokine/chemokine levels in supernatant from MF (c) cocultured with non-activated or activated CD4 T cells (n = 8 CD4 + T cell isolations; n = 3 experiments for MF alone, *p = 0.0134, **p = 0.0047 for CCL2, **p = 0.0065, ***p = 0.0002 for IL-6 by two-tailed Mann–Whitney and ##p = 0.0078 by two-tailed Wilcoxon matched-pairs signed rank test for CCL2), (d) following direct contact or exposure to the conditioned medium (CM) of activated CD4 T cells (n = 6 different CD4 T cell isolations, *p = 0.0411, **p = 0.0022 by two-tailed Mann–Whitney) and (e) exposed to CM of activated ATG5Tlymph-/- or WT CD4 T cells, following neutralization with 10 μg/ml IL-17A antibody or isotype (n = 12 different CD4 T cell isolations for isotypes group and n = 10 for ATG5TLymph-/- CD4+anti-IL-17A, **p = 0.0029 for CCL2, *p = 0.0261, ***p = 0.0004 for CXCL10, ***p = 0.0004 for IL-6, ****p = < 0.0001for KC/IL-8 by two-tailed Mann–Whitney and ##p = 0.0059 for CCL2, ##p = 0.0098 for IL-6, ##p = 0.0020 for KC/IL-8 by two-tailed Wilcoxon matched-pairs signed rank test). Results are expressed as fold over MF +activated ATG5fl/fl CD4 T cells. f Experimental co-culture protocol of primary hepatocytes with CM from activated CD4 T cells from either ATG5TLymph-/- or WT mice. When indicated 10 μg/ml anti-IL-17A neutralizing antibody or control isotype was added. g mRNA gene expression of chemokines and cytokines in hepatocytes (n = 9 different CD4 T cell isolations, **p = 0.0019 for Cxcl1, ***p = 0.0005 (ATG5fl/fl CD4+isotype vs ATG5TLymph-/-CD4+isotype), ***p = 0.0003 (ATG5fl/fl CD4+isotype vs ATG5TLymph-/-CD4+anti-IL-17A) for Cxcl10, ***p = 0.0004 for Ccl2, **p = 0.0084 for Il6 by two-tailed Mann–Whitney and ##p = 0.0078 for Cxcl1, #p = 0.0391 for Cxcl2, #p = 0.0156 by two-tailed Wilcoxon matched-pairs signed rank test). Results are expressed as fold over hepatocytes +activated ATG5fl/fl CD4 T cells. Data are mean ± S.E.M. ns: not significant. Source data are provided as a Source Data file. a, f Created in BioRender. Gilgenkrantz, H. (2025) https://BioRender.com/l88g711.
Fig. 5
Fig. 5. Autophagy-deficient CD4 T cells shift macrophages toward a pro-inflammatory phenotype.
a Flow cytometry analysis of the frequency and cytokine production of intrahepatic CD11b + F4/80+ MoMac from CCl4-exposed ATG5TLymph-/- and ATG5fl/fl mice (n = 13 ATG5fl/fl and n = 12 ATG5TLymph-/- mice, pooled data from 2 experiments, *p = 0.0257 for IL-1α, *p = 0.0457 for pro-IL-1β). b Experimental protocol of bone marrow-derived macrophages (BMDMs)/CD4 T cell co-culture created in BioRender. Gilgenkrantz, H. (2025) https://BioRender.com/l88g711. c (left) Intracellular staining of 1 ng/ml LPS-stimulated BMDMs for IL-1α and pro-IL-1β. (right) ELIZA on the co-culture supernatant (n = 8 different isolations, *p = 0.0145, **p = 0.0045, ***p = 0.002). d Representative dot plots and mean quantification of IL-1α and pro-IL-1β in BMDMs co-cultures (n = 4 mice/group), transwell (n = 4 mice/group, *p = 0.0286), or in the presence of 10 μg/ml control isotype, IL-17A (n = 4 mice/group, *p = 0.0286)or GM-CSF neutralizing antibody for 24 hrs (n = 8 mice/group, **p = 0.0028, *p = 0.0390 and ##p = 0.0078 by two-tailed Wilcoxon matched-pairs signed rank test). Data are mean ± S.E.M. Statistical analysis was performed by two-tailed Mann-Whitney, unless otherwise indicated. Source data are provided as a Source Data file.
Fig. 6
Fig. 6. Activation of autophagy in T cells inhibits inflammation and reduces fibrosis.
a Western blot analysis of CD4 T cell lysates from patients with extended fibrosis/cirrhosis exposed to 1 µM AZD8055 or vehicle for 3 hrs. LC3 expression was measured in the presence of 30 µM CQ (n = 7 patients, #p = 0.0156). Lanes have been rearranged; non-adjacent lanes are separated by a vertical black line. b Flow cytometry analysis of the frequency of IL-17A + IFN-γ + and IFN-γ + cells among CD4 + T cells (n = 8 patients, ##p = 0.0078, #p = 0.0312) and ELIZA quantification of GM-CSF secretion in PBMCs from patients with extended fibrosis/cirrhosis exposed to 10 μM AZD8055 (n = 7 patients). c, d RUBCNTlymph-/- and their WT counterparts mice were injected with CCl4 twice a week for 5 weeks. c Representative images and quantification of SR (n = 18 RUBCNfl/fl and n = 14 RUBCNTLymph-/-mice, pooled data from 4 experiments, **p = 0.0065) and α-SMA + areas in liver tissue sections (n = 10 mice/group, pooled data from 2 experiments, ***p = 0.0006). d Hepatic expression of inflammatory cytokines, chemokines, and chemokine receptors genes (n = 18 RUBCNfl/fl and n = 14 RUBCNTLymph-/-mice, pooled data from 4 experiments, *p = 0.0282 for Il1b, *p = 0.0205 for Tnfa, *p = 0.0139 for Ccl2 and *p = 0.040 for Cxcl10). e Flow cytometry analysis of IL-17A + IFN-γ-, IL-17A + IFN-γ + (n = 17 mice/group, pooled data from 3 experiments), and IL-17A + IL-22+ (n = 12 RUBCNfl/fl and n = 14 RUBCNTLymph-/-mice, pooled data from 2 experiments, *p = 0.0322) CD4 T cell frequencies in the liver of RUBCNTLymph-/- and WT littermates exposed to CCl4. Scale bar is 100 μm. be Data are mean ± S.E.M. Statistical analysis was performed by (a, b) two-tailed Wilcoxon matched-pairs signed rank and (ce) by two-tailed Mann-Whitney test. Source data are provided as a Source Data file.

References

    1. Gilgenkrantz, H., Sayegh, R. A. & Lotersztajn, S. Immunoregulation of liver fibrosis: new opportunities for antifibrotic therapy. Annu Rev. Pharm. Toxicol.65, 281–299 (2025). - PubMed
    1. Carter, J. K. & Friedman, S. L. Hepatic stellate cell-immune interactions in NASH. Front Endocrinol. (Lausanne)13, 867940 (2022). - PMC - PubMed
    1. Mallat, A. & Lotersztajn, S. Cellular mechanisms of tissue fibrosis. 5. novel insights into liver fibrosis. Am. J. Physiol. Cell Physiol.305, C789–C799 (2013). - PubMed
    1. Ramachandran, P. et al. Resolving the fibrotic niche of human liver cirrhosis at single-cell level. Nature575, 512–518 (2019). - PMC - PubMed
    1. Barron, L. & Wynn, T. A. Fibrosis is regulated by Th2 and Th17 responses and by dynamic interactions between fibroblasts and macrophages. Am. J. Physiol. Gastrointest. Liver Physiol.300, G723–G728 (2011). - PMC - PubMed

MeSH terms