

HarvestStat Africa - Harmonized Subnational Crop Statistics for Sub-Saharan Africa
- PMID: 40274821
- PMCID: PMC12022251
- DOI: 10.1038/s41597-025-05001-z
HarvestStat Africa - Harmonized Subnational Crop Statistics for Sub-Saharan Africa
Abstract
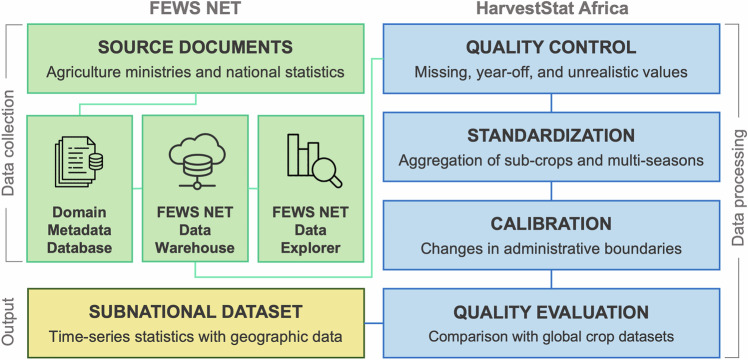
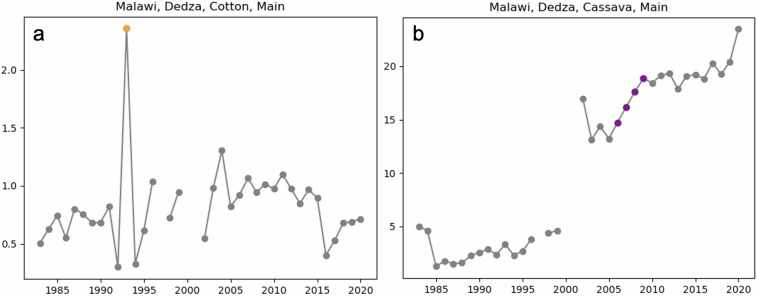
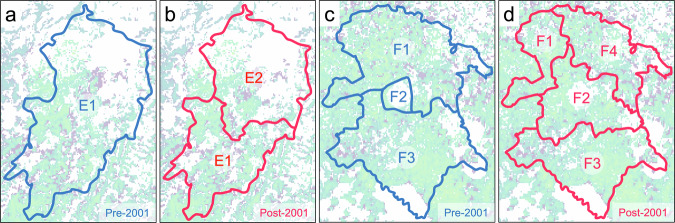
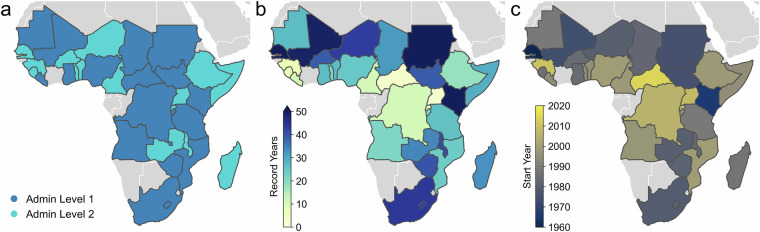
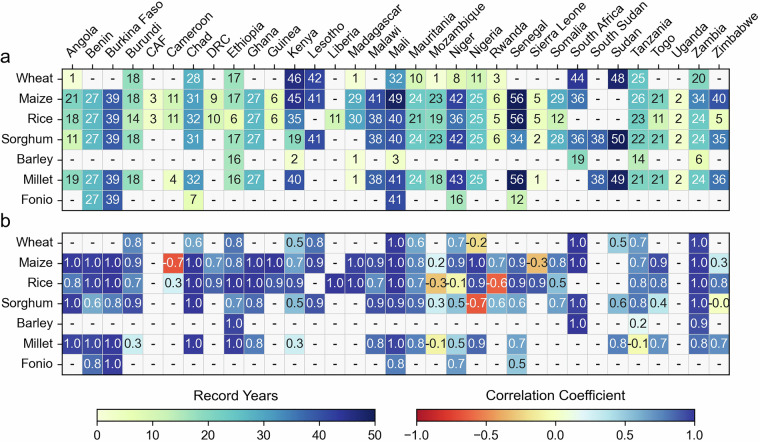
Sub-Saharan Africa faces severe agricultural data scarcity amidst high food insecurity and a large agricultural yield gap, making crop production data crucial for understanding and enhancing food systems. To address this gap, HarvestStat Africa presents the largest compilation of open-access subnational crop statistics and time-series across Sub-Saharan Africa. Based on agricultural statistics collated by USAID's Famine Early Warning Systems Network, the subnational crop statistics are standardized and calibrated across changing administrative units to produce consistent and continuous time-series. The dataset includes 574,204 records, primarily spanning from 1980 to 2022, detailing quantity produced, harvested areas, and yields for 33 countries and 94 crop types, including key cereals in Sub-Saharan Africa such as wheat, maize, rice, sorghum, barley, millet, and fonio. This new dataset enhances our understanding of how climate variability and change influence agricultural production, supports subnational food system analysis, and aids in operational yield forecasting. As an open-source resource, it establishes a precedent for sharing subnational crop statistics to inform decision-making and modeling efforts.
© 2025. The Author(s).
Conflict of interest statement
Competing interests: The authors declare no competing interests.
Figures

References
-
- Neumann, K., Verburg, P. H., Stehfest, E. & Müller, C. The yield gap of global grain production: A spatial analysis. Agric. Syst.103, 316–326 (2010).
-
- Van Ittersum, M. K. et al. Yield gap analysis with local to global relevance—A review. Field Crops Res.143, 4–17 (2013).
-
- Iizumi, T. et al. Historical changes in global yields: major cereal and legume crops from 1982 to 2006. Glob. Ecol. Biogeogr.23, 346–357 (2014).
-
- Becker-Reshef, I. et al. Prior Season Crop Type Masks for Winter Wheat Yield Forecasting: A US Case Study. Remote Sens.10, 1659 (2018).
Publication types
MeSH terms
Grants and funding
- G21AC00026/Department of the Interior | United States Geological Survey | Wyoming-Montana Water Science Center (USGS Wyoming-Montana Water Science Center)
- G21AC00026/Department of the Interior | United States Geological Survey | Wyoming-Montana Water Science Center (USGS Wyoming-Montana Water Science Center)
- CRC-2022-00320/Canada Research Chairs (Chaires de recherche du Canada)
- AID-720BHAH00005/NASA | Goddard Space Flight Center (NASA's Goddard Space Flight Center)
- A118199/Volkswagen Foundation (VolkswagenStiftung)
- A118199/Volkswagen Foundation (VolkswagenStiftung)
- 16QK04B/Bundesministerium für Bildung und Forschung (Federal Ministry of Education and Research)
- DFG-FZT 118, 202548816/Deutsche Forschungsgemeinschaft (German Research Foundation)
- DFG-FZT 118, 202548816/Deutsche Forschungsgemeinschaft (German Research Foundation)
LinkOut - more resources
Full Text Sources
Research Materials
Miscellaneous
