Comparative Study
. 2025 Apr 24;15(1):14387.
doi: 10.1038/s41598-025-99247-7.

Comparing neural responses to cutaneous heat and pressure pain in healthy participants

Affiliations
Comparative Study

Comparing neural responses to cutaneous heat and pressure pain in healthy participants

Janne Ina Nold et al. Sci Rep. .

Abstract

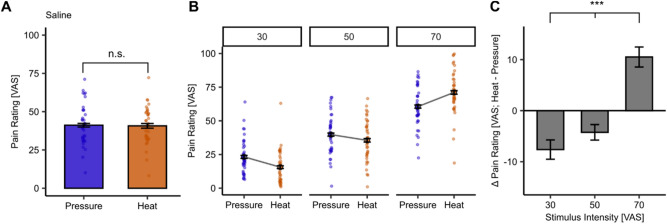
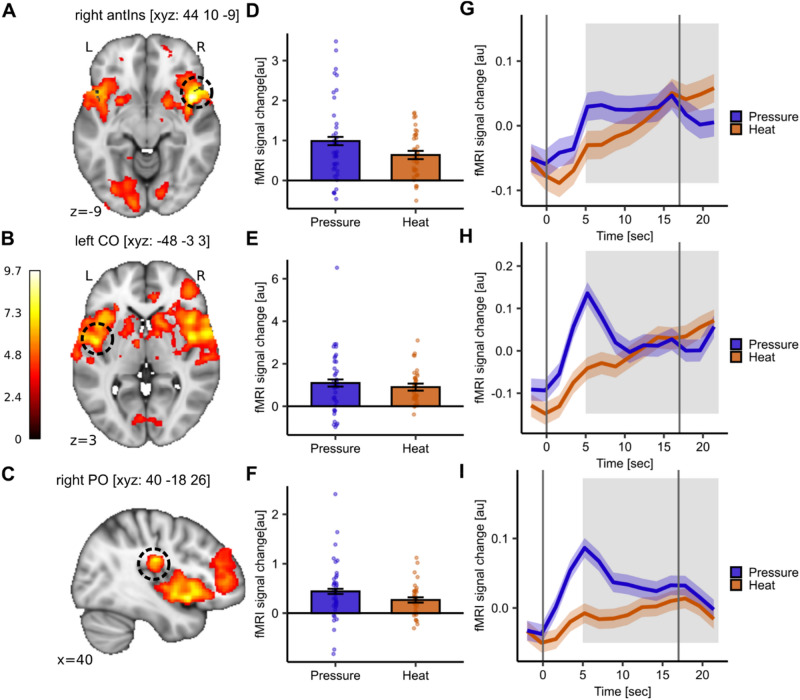
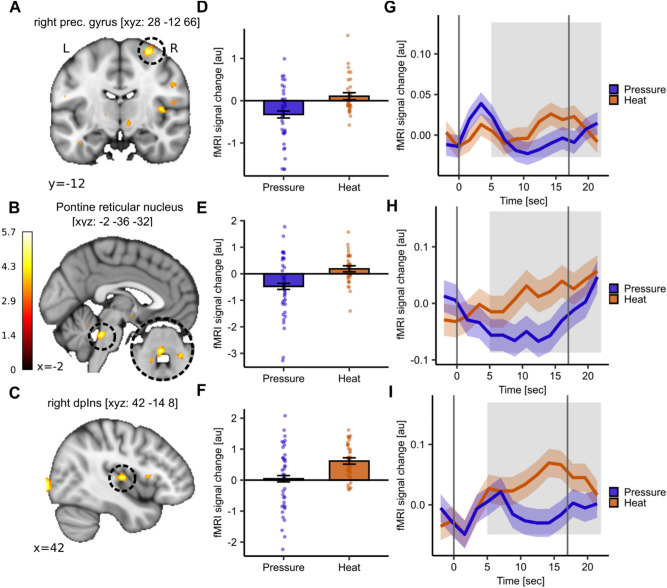
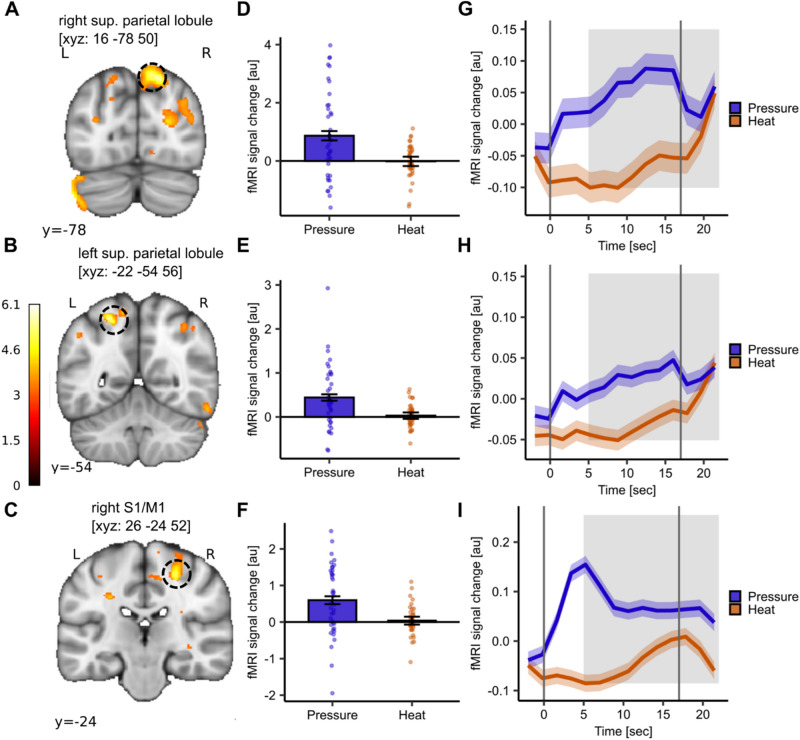
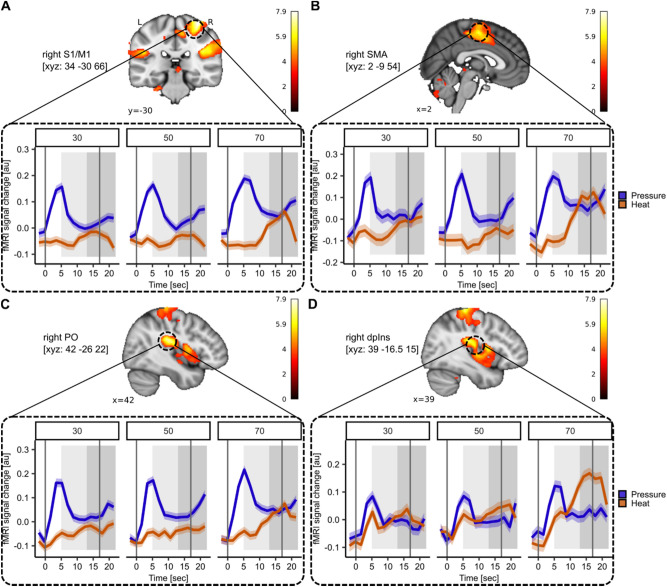
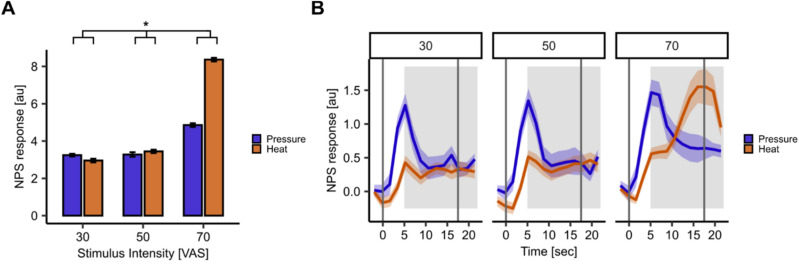
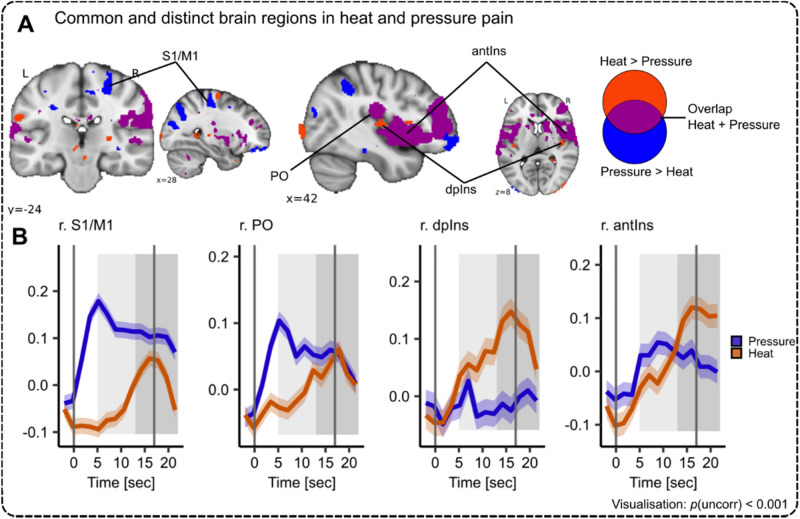
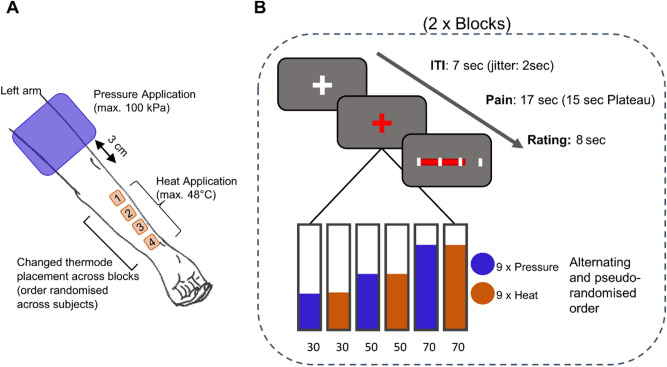
Even though acute pain comes in many different shapes and forms, a lot of experimental pain studies predominantly employ cutaneous heat pain. This makes a comparison between different pain types and the link between findings from these experimental studies to clinical pain difficult. To bridge this gap, we investigated both cuff pressure pain and cutaneous heat pain using a within-subject design in combination with functional magnetic resonance imaging (fMRI). Noxious stimuli were applied with a 17-s duration at three different intensities above the pain threshold using a thermode and a computer-controlled cuff pressure device. Both pain modalities led to contralateral activation in the anterior insula and parietal operculum. Heat pain showed greater activation in the precentral gyrus, pontine reticular nucleus, and dorsal posterior insula, whilst pressure pain showed greater activation in the primary somatosensory cortex and bilateral superior parietal lobules. Most importantly, the time course of the fMRI signal changes differed between modalities, with pressure pain peaking in the first stimulus half, whereas heat pain led to a prolonged and increasing response across the stimulus duration with a peak in the second stimulus half. Our findings suggest that pressure and heat pain lead to common as well as different (temporal) activation patterns in key pain processing regions.

Keywords: Cuff pressure; Cutaneous heat; Neuroimaging; Nociception; Pain; fMRI.


Conflict of interest statement

Declarations. Competing interests: The authors declare no competing interests.

Figures

Fig. 1
Fig. 1
Behavioural results for heat and pressure pain. (A) No significant main effect of modality (heat (orange) and pressure (blue)) on pain ratings averaged across all intensities (p = 0.78). Bar plots depict average pain ratings with dots showing subject-specific mean ratings across all stimulus intensities. (B) Main effect of stimulus intensity on heat pain ratings (p < 2 × 10−16) and pressure pain ratings (p < 2 × 10−16). The interaction of stimulus intensity and modality was significant (p = 7.25 × 10−16). Individual dots depict subject-specific mean ratings at each stimulus intensity (VAS 30, 50, 70) and lines connect mean pain ratings across subjects at each stimulus intensity (VAS 30, 50, 70) in heat and pressure pain. Error bars depict the standard error of the mean (SEM). (C) Main effect of stimulus intensity (p = 1.44 × 10−9) on the difference rating between heat and pressure pain ratings at each stimulus intensity [Heat–Pressure pain rating]. Error bars depict the SEM. n.s. = not significant, *p < 0.05, **p < 0.01, ***p < 0.001.
Fig. 2
Fig. 2
Common neural activation of heat and pressure pain stimulation. (AC) Significant common activation patterns from the conjunction analysis of contrasts heat and pressure pain in right anterior Insula (antIns; MNIxyz: 44, 10, − 9; T = 9.68, pWB-FWE < 0.001), left central operculum (CO; MNIxyz: − 48, − 3, 3; T = 7.62, pWB-FWE < 0.001), and right parietal operculum (PO; MNIxyz: 40, − 18, 26; T = 7.47, pWB-FWE < 0.001). (DF) Barplots depict mean parameter estimates from boxcar function (i.e. average of stimulus duration) extracted from respective peak voxels and dots show subject-specific mean parameter estimates for heat (orange) and pressure (blue) pain. Error bars depict the SEM. (GI) Time course of BOLD response for heat (orange) and pressure (blue) stimuli in the respective peak voxel averaged across all stimulus intensities. The shaded areas around the curves represent the SEM. The grey solid lines indicate stimulus start and stimulus end and the shaded grey area displays the approximate time window for BOLD response (5 s after stimulus onset and stimulus offset). For visualisation purposes, the uncorrected activation maps are displayed at puncorr < 0.001.
Fig. 3
Fig. 3
Distinct neural activation of heat pain compared to pressure pain. (AC) Significant activation for the contrast heat > pressure pain in right precentral gyrus (MNIxyz: 28, − 12, 66; T = 5.19, pWB-FWE = 0.02) and pontine reticular nucleus (caudal part; MNIxyz: − 2, − 36, − 32; T = 5.07, pWB-FWE = 0.03) as well as approaching significance in the right dorsal posterior insula (dpIns; MNIxyz: 42, − 14, 8; T = 4.73, pWB-FWE = 0.11). (DF) Barplots depict mean parameter estimates from boxcar function (i.e. average of stimulus duration) extracted from respective peak voxels and dots show subject-specific mean parameter estimates for heat (orange) and pressure (blue) pain. Error bars depict the SEM. (GI) Time course of BOLD response for heat (orange) and pressure (blue) stimuli in the respective peak voxel averaged across all stimulus intensities. The shaded areas around the curves represent the SEM. The grey solid lines indicate stimulus start and stimulus end and the shaded grey area displays the approximate time window for BOLD response (5 s after stimulus onset and stimulus offset). For visualisation purposes, the uncorrected activation maps are displayed at puncorr < 0.001.
Fig. 4
Fig. 4
Distinct neural activation of pressure pain compared to heat pain. (AC) Significant activation for the contrast pressure > heat pain in the (A) right superior parietal lobule (MNIxyz: 16, − 78, 50; T = 5.66, pWB-FWE = 0.002), (B) left superior parietal lobule MNIxyz: − 22, − 54, 56; T = 5.65, pWB-FWE = 0.003) and (C) right S1/M1 (MNIxyz: 26, − 24, 52; T = 5.25, pWB-FWE = 0.01). (DF) Barplots depict mean parameter estimates from boxcar function (i.e. average of stimulus duration) extracted from respective peak voxels and dots show subject-specific mean parameter estimates for heat (orange) and pressure (blue) pain. Error bars depict the SEM. (GI) Time course of BOLD response for heat (orange) and pressure (blue) stimuli in the respective peak voxel averaged across all stimulus intensities. The shaded areas around the curves represent the SEM. The grey solid lines indicate stimulus start and stimulus end and the shaded grey area displays the approximate time window for BOLD response (5 s after stimulus onset and stimulus offset). For visualisation purposes, the uncorrected activation maps are displayed at puncorr < 0.001.
Fig. 5
Fig. 5
Different neural activation patterns for the ‘early’ and ‘late’ phases in heat and pressure pain. (AC) Significant activation for the contrast interaction modality and stimulus half calculated across stimulus intensities in the (A) right S1/M1 (MNIxyz: 34, − 30, 66; T = 7.91, pWB-FWE < 0.001), (B) right supplementary motor area (SMA; MNIxyz: 2, − 9, 54; T = 6.50, pWB-FWE < 0.001) and (C) right parietal operculum (PO; MNIxyz: 42, − 26, 22; T = 7.23, pWB-FWE < 0.001). (D) Activation in the right dorsal posterior insula (dpIns) has been visualised for completeness (MNIxyz: 39, − 16.5, 15; T = 5.73). The BOLD response time courses for heat (orange) and pressure (blue) stimuli in the respective peak voxels were visualised for each stimulus intensity (VAS 30, 50, 70) for heat (orange) and pressure (blue) pain. The shaded areas around the curves represent the SEM. The grey solid lines indicate the stimulus start and stimulus end. The shaded light grey area displays the approximate time window for BOLD response in the first stimulus half (5 s after stimulus onset) and the shaded dark grey area displays the approximate time window for BOLD response in the second stimulus half (5 s after the first stimulus half end). For visualisation purposes, the uncorrected activation maps are displayed at puncorr < 0.001.
Fig. 6
Fig. 6
Neurologic Pain Signature (NPS) response. (A) NPS scores extracted from normalised and smoothed first-level contrast images of each intensity contrast (VAS 30, 50, 70) and each modality (heat (orange) and pressure (blue)) multiplied with the NPS mask showed a significant interaction of modality and stimulus intensity (p = 0.02) with the greatest response to heat pain at the highest stimulus intensity (VAS 70). Error bars indicate SEM. (B) Time course of NPS estimates shown for both modalities (heat and pressure pain) at all stimulus intensities (VAS 30, 50, 70). Shaded areas around the curves represent SEM. The grey solid lines indicate stimulus start and end and the shaded grey area displays the approximate time window for BOLD response (5 s after stimulus onset).
Fig. 7
Fig. 7
Overview of neural and temporal activation patterns in response to heat and pressure pain. (A) Common (purple: conjunction heat and pressure pain) and distinct (red: heat > pressure pain; blue: pressure > heat pain) cortical activation in response to heat and pressure pain (pFWE-WB < 0.05). (B) Exemplary response curves for heat (orange) and pressure (blue) time course extracted from respective significant peak voxels at highest stimulus intensity (VAS 70). Shaded areas around the curves represent SEM. The grey solid lines indicate the stimulus start and end. The shaded light grey area displays the approximate time window for BOLD response in the first stimulus half (5 s after stimulus onset) and the shaded dark grey area displays the approximate time window for BOLD response in the second stimulus half (5 s after the first stimulus half end). n.s. = not significant, *p < 0.05, **p < 0.01, ***p < 0.001.
Fig. 8
Fig. 8
Experimental design. (A) Stimulus application of heat pain (max. 48 °C) and cuff pressure pain (max. 100 kPa) on the lower and upper left arm, respectively. (B) Two blocks with alternating heat (9×) and pressure (9×) pain at three different intensities (VAS 30, 50, 70). Each stimulus had a 15-s plateau and was followed by an 8-s VAS rating.

Similar articles

References

    1. Capra, N. F. & Ro, J. Y. Human and animal experimental models of acute and chronic muscle pain: Intramuscular algesic injection. Pain110, 3 (2004). - PubMed
    1. Owen, D. G., Clarke, C. F., Ganapathy, S., Prato, F. S. & St. Lawrence, K. S. Using perfusion MRI to measure the dynamic changes in neural activation associated with tonic muscular pain. Pain148, 375 (2010). - PubMed
    1. Svensson, P., Minoshima, S., Beydoun, A., Morrow, T. J. & Casey, K. L. Cerebral processing of acute skin and muscle pain in humans. J. Neurophysiol.78, 450–460 (1997). - PubMed
    1. Thunberg, J. et al. Brain processing of tonic muscle pain induced by infusion of hypertonic saline. Eur. J. Pain9, 185–194 (2005). - PubMed
    1. Graven-Nielsen, T., Arendt-Nielsen, L., Svensson, P. & Jensen, T. S. Experimental muscle pain: A quantitative study of local and referred pain in humans following injection of hypertonic saline. J. Musculoskelet. Pain5, 49–69 (1997). - PubMed

Publication types