

Consequences of vitamin D deficiency or overdosage on follicular development and steroidogenesis in Normo and hypo calcemic mouse models
- PMID: 40274992
- PMCID: PMC12022079
- DOI: 10.1038/s41598-025-99437-3
Consequences of vitamin D deficiency or overdosage on follicular development and steroidogenesis in Normo and hypo calcemic mouse models
Abstract
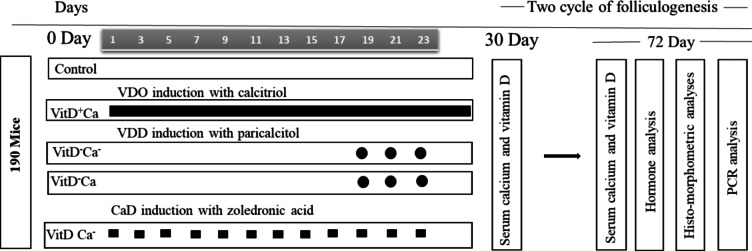
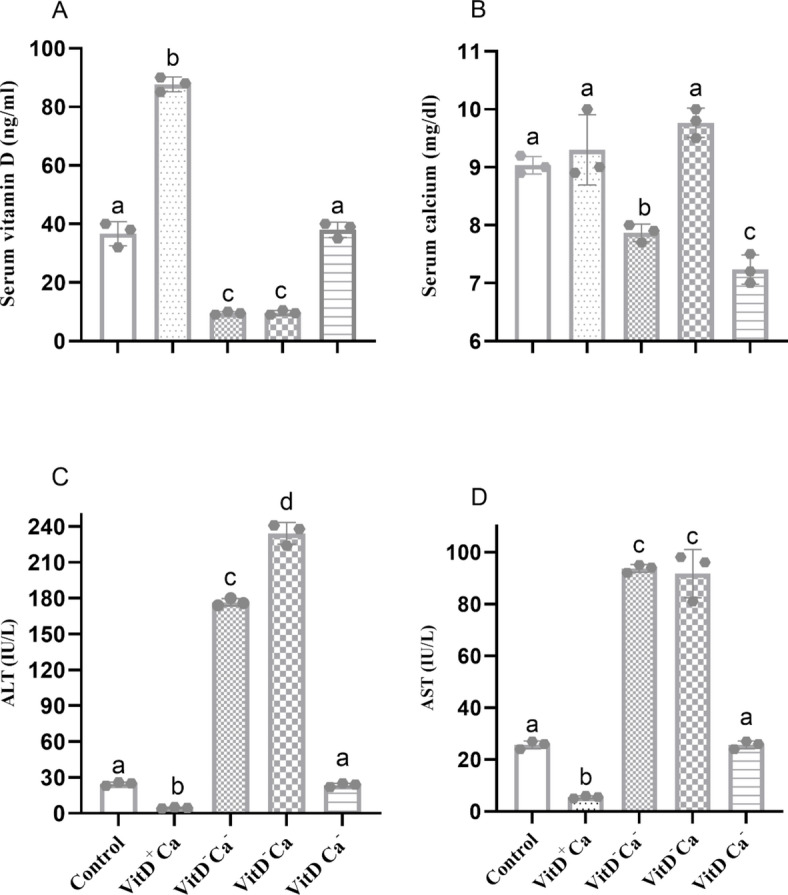
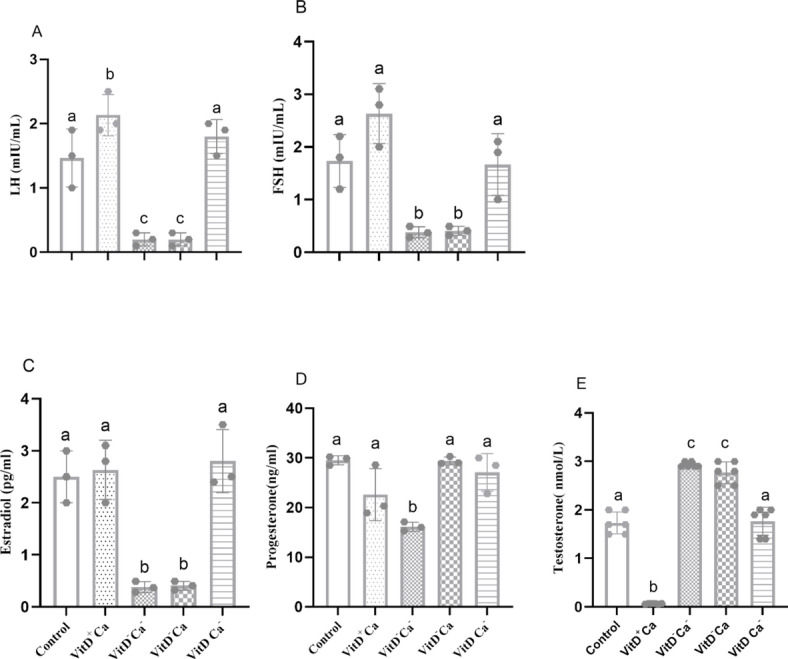
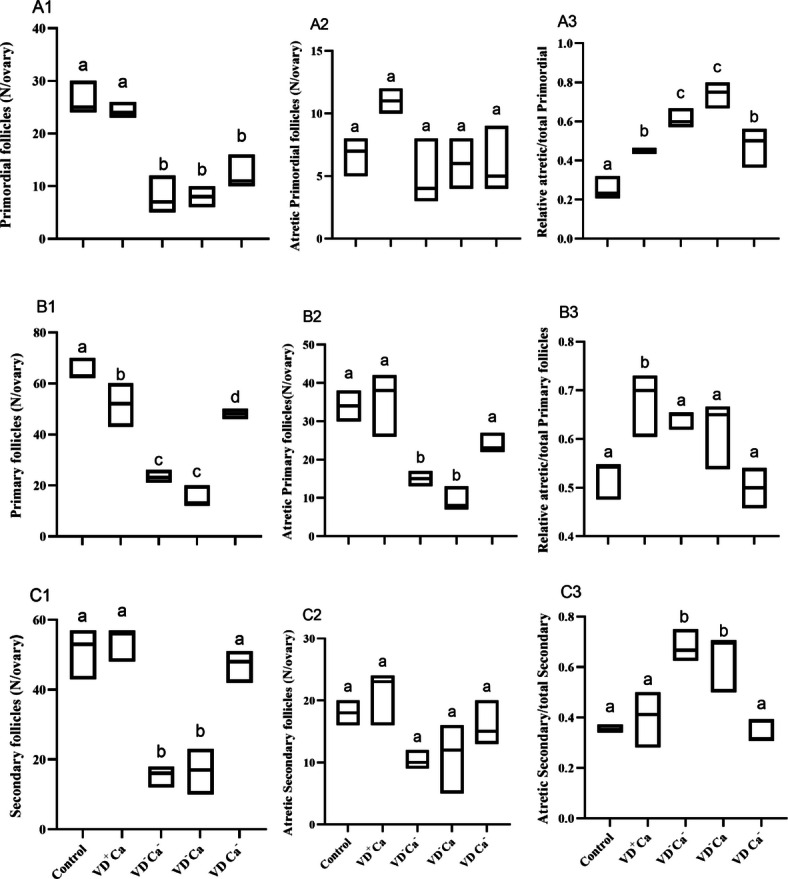
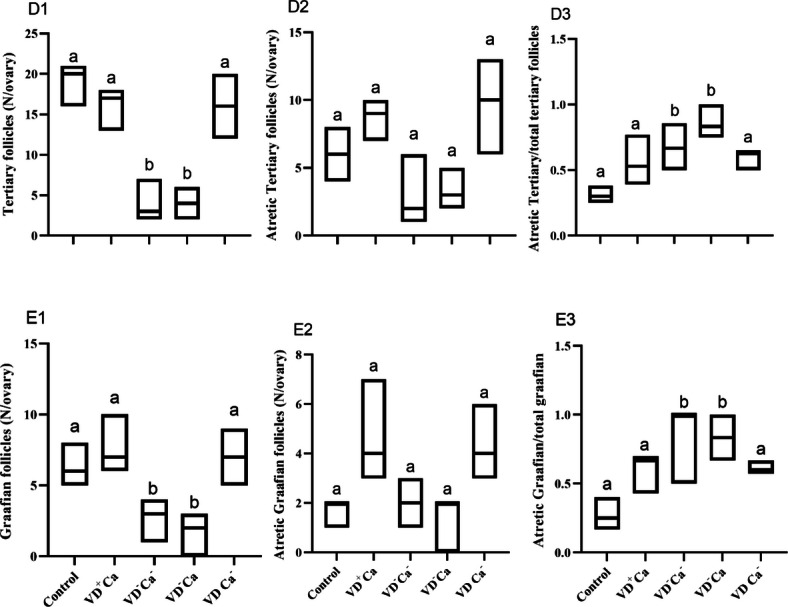
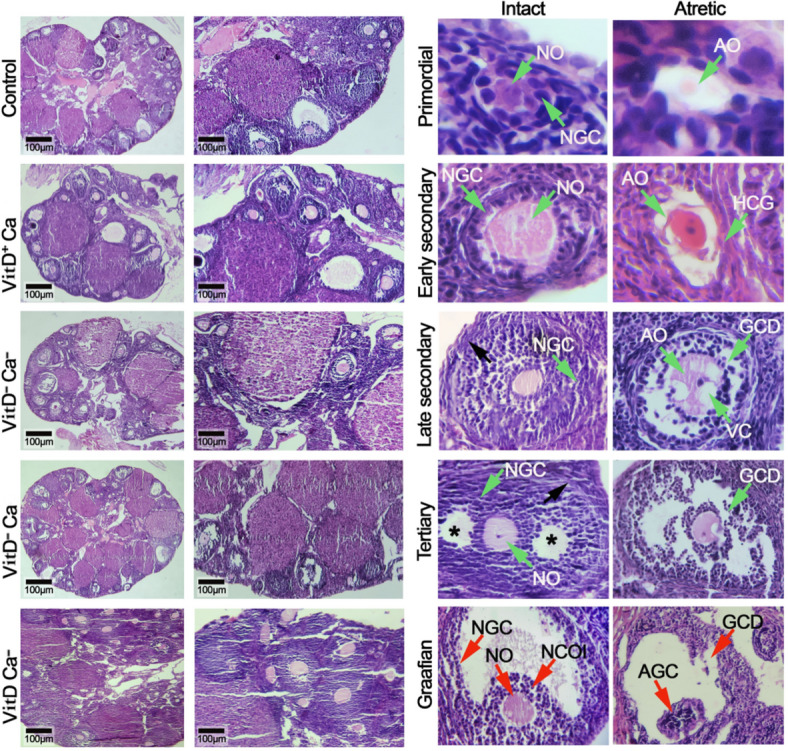
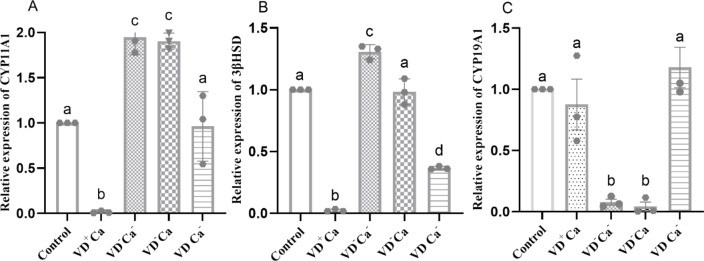
Vitamin D deficiency (VDD) is a widespread situation, linked to patients' dietary habits and/or geographical origins. On the other hand, hypervitaminosis D (VDO) is also a worldwide problem, mainly associated with uncontrolled self-administration. In this study, we investigated the effects of VDD and VDO on sex steroid production and ovarian histology in mice. In addition to addressing the rarely explored situation of VDO, the originality of our approach is to disconnect VDD/VDO situations from the well-known calciotrophic effect of vitamin D (VitD). Our data indicate that VDD led to a significant decrease in serum LH and FSH levels, independently of serum calcium levels. VDD was also associated with increased testosterone and reduced oestradiol levels. VDO animals showed increased LH and reduced testosterone levels. Hormonal changes in the VDO animal groups were correlated with a lower accumulation of transcripts of steroidogenic genes such as CYP11A1 and 3ß-HSD, whereas these transcripts were higher in the VDD groups. CYP19A1 transcripts were lower in VDD animals than in controls. This study highlights the complex interaction between vitamin D status, the regulation of reproductive hormones and, consequently, reproductive performance. It underlines the need for caution when oral vitamin D supplementation is chosen as a therapeutic action to boost female reproductive performance, as VDO can be as detrimental as VDD.
Keywords: Liver enzyme; Ovary; Reproduction; Sex steroids; Vitamin D deficiency; Vitamin D overdose.
© 2025. The Author(s).
Conflict of interest statement
Declarations. Competing interests: The authors declare no competing interests.
Figures
Similar articles
-
Vitamin D deficiency and low ionized calcium are linked with semen quality and sex steroid levels in infertile men.Hum Reprod. 2016 Aug;31(8):1875-85. doi: 10.1093/humrep/dew152. Epub 2016 Jun 19. Hum Reprod. 2016. PMID: 27496946
-
Steroidogenesis in the preovulatory porcine follicle.Biol Reprod. 1994 Oct;51(4):655-61. doi: 10.1095/biolreprod51.4.655. Biol Reprod. 1994. PMID: 7819446
-
Time Course of Vitamin D Depletion and Repletion in Reproductive-age Female C57BL/6 Mice.Comp Med. 2017 Dec 1;67(6):483-490. Comp Med. 2017. PMID: 29212579 Free PMC article.
-
A study of the endocrine manifestations of hepatic cirrhosis.Q J Med. 1976 Jan;45(177):145-78. Q J Med. 1976. PMID: 769039
-
Maternal vitamin D deficiency and developmental origins of health and disease (DOHaD).J Endocrinol. 2019 May;241(2):R65-R80. doi: 10.1530/JOE-18-0541. J Endocrinol. 2019. PMID: 30909167 Free PMC article. Review.
References
-
- Holick, M. Evaluation, treatment, and prevention of vitamin D deficiency: an endocrine society clinical practice guideline. J. Clin. Endocrinol. Metabolism. 96 (7), 1911–1930 (2011). - PubMed
-
- Kaur, P., Mishra, S. K. & Mithal A.Vitamin D toxicity resulting from overzealous correction of vitamin D deficiency. Clin. Endocrinol.83 (3), 327–331 (2015). - PubMed
-
- Veenstra, T. 1, 25-Dihydroxyvitamin D3 receptors in the central nervous system of the rat embryo. Brain Res.804 (2), 193–205 (1998). - PubMed
-
- Cui, X., Gooch, H., Petty, A., McGrath, J. J. & Eyles D.Vitamin D and the brain: genomic and non-genomic actions. Mol. Cell. Endocrinol.453, 131–143 (2017). - PubMed
MeSH terms
Substances
LinkOut - more resources
Full Text Sources
Medical
