

Drivers of female power in bonobos
- PMID: 40275064
- PMCID: PMC12022330
- DOI: 10.1038/s42003-025-07900-8
Drivers of female power in bonobos
Abstract
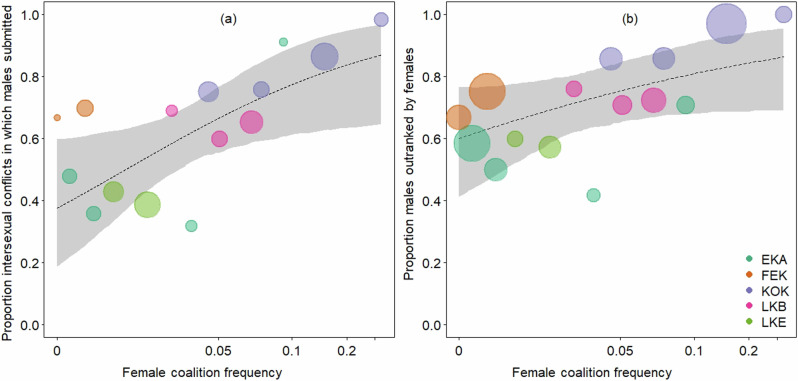
In mammals, female dominance over males is a rare phenomenon. However, recent findings indicate that even in species with sexual dimorphism biased towards males, females sometimes occupy high status. Here we test three main hypotheses explaining intersexual power relationships, namely the self-reinforcing effects of winning and losing conflicts, the strength of mate competition, and female coalition formation. We test these for bonobos (Pan paniscus), one of our closest living relatives, where females have high status relative to males despite male-biased size dimorphism. We compiled demographic and behavioral data of 30 years and 6 wild living communities. Our results only support predictions of the female coalition hypothesis. We found that females target males in 85% of their coalitions and that females occupy higher ranks compared to males when they form more frequent coalitions. This result indicates that female coalition formation is a behavioral tool for females to gain power over males.
© 2025. The Author(s).
Conflict of interest statement
Competing interests: The authors declare no competing interests.
Figures

References
-
- Ralls, K. Sexual Dimorphism in Mammals: Avian Models and Unanswered Questions. Am. Naturalist111, 917–938 (1977).
-
- Parker, G. A. Assessment Strategy and Evolution of Fighting Behavior. J. Theor. Biol.47, 223–243 (1974). - PubMed
-
- Simon, H. A. Notes on the Observation and Measurement of Political Power. J. Politics15, 500–516 (1953).
-
- Lewis, R. J. Beyond dominance: The importance of leverage. Q. Rev. Biol.77, 149–164 (2002). - PubMed
MeSH terms
LinkOut - more resources
Full Text Sources
