. 2025 Apr 24;8(1):659.
doi: 10.1038/s42003-025-08084-x.

Neural regulation of H3K27me3 during the induction of patterning competency in regenerating Axolotl limb cells

Affiliations

Neural regulation of H3K27me3 during the induction of patterning competency in regenerating Axolotl limb cells

Michael J Raymond et al. Commun Biol. .

Abstract

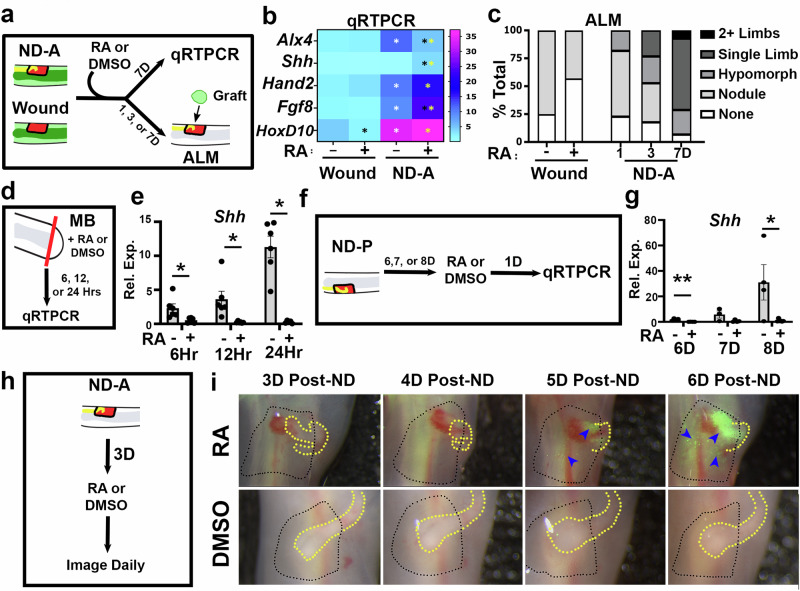
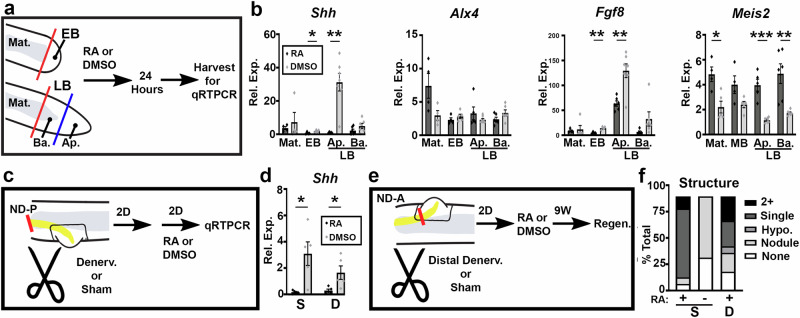
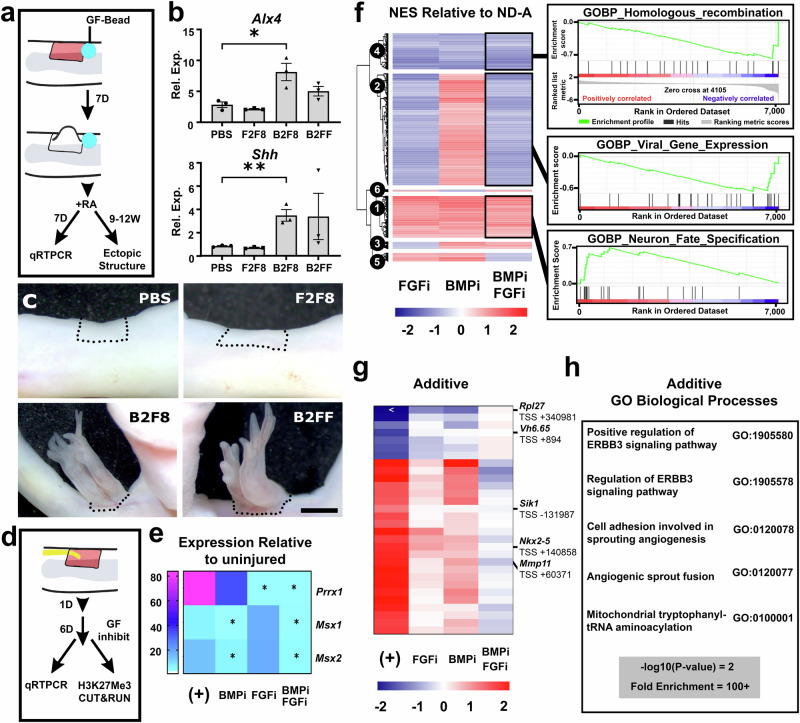
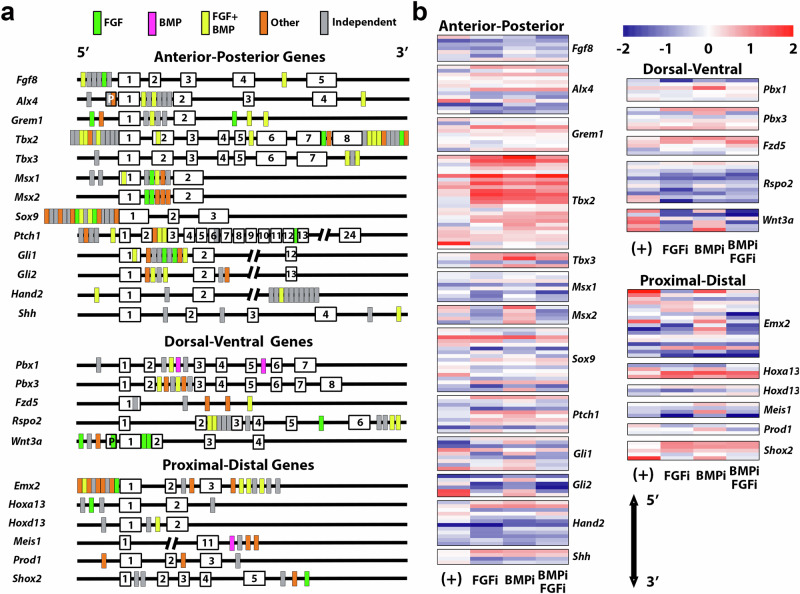
Limb regeneration in the Mexican axolotl relies on the dedifferentiation of mature limb cells into blastema cells, which gain the ability to respond to patterning signals that guide tissue regeneration. While limb nerves are essential to make the blastema cells competent to pattern, the mechanisms remain unclear due to the complex and overlapping signals in amputated limbs. To overcome this challenge, we developed the Competency Accessory Limb Model (CALM), a simplified limb regeneration assay to study the induction and maintenance of patterning competency. Using CALM, here we show specific temporal windows during which cells acquire competency and associate this state with distinct H3K27me3 chromatin signatures. Furthermore, a combination of FGF and BMP signaling is sufficient to induce patterning competency in limb wound cells, and the ErBB signaling pathway is a downstream epigenetic target of these signals. These findings offer new insights into the molecular regulation of regenerative patterning.


Conflict of interest statement

Competing interests: The authors declare no competing interests.

Figures

Fig. 1
Fig. 1. Description of the CALM assay.
(Left boxes) Nerve deviations (ND) are performed by surgically deviating the branchial nerve bundle (yellow) to a lateral full thickness skin wound on the limb, which leads to the formation of a blastema (Endo et al.). In the case of an anterior positioned ND (ND-A), within 7-days of surgery, there is a significant increase in the expression of “anterior” limb patterning genes, such as Alx4. Posterior positioned NDs (ND-P), exhibit a significant increase in the expression of “posterior” limb patterning genes, including Shh (Vieira et al.). In both ND-A and ND-Ps, the blastema eventually regresses. (Right boxes) The Competency Accessory Limb Model (CALM) utilizes retinoic acid treatment to assess whether a ND-A or ND-P wound site has achieved competency to pattern limb structures. The achievement of patterning competency of the ND wound tissue can be identified in two ways; (1) location-specific changes in A/P patterning gene expression and (2) (in anterior-located tissue only) the formation of ectopic limb patterns (Vieira et al.).
Fig. 2
Fig. 2. Determining the neural requirement and timing of patterning competency induction in limb wound cells.
a Experimental design and treatment scheme of ND-A and A-wounds samples evaluated using the CALM assay. b Heat map representing qRT-PCR data of A/P patterning gene expression in DMSO (−) or RA (+) treated wounds and ND-As (positive control) relative to uninjured limb skin. Scale bar indicates expression relative to Ef1α (N = 3–5 biological replicates per sample group, p < 0.05 using the unpaired t-test) Black * indicates significant change in expression between RA and DMSO within the same injury-type, and yellow * indicates significant change in expression between RA treated groups. c Histogram representing the % of total ALM sites (from a) that exhibit the different ectopic growth phenotypes 9-weeks after grafts were implanted. The tissues were treated with RA (+,1-,3-,7-days) or DMSO (−) prior to grafting to the host ALM. (N = 8–18 biological replicates per sample group—refer to Supplementary Data 1.1). d Generation and treatment scheme of MB-staged blastemas 6-, 12-, or 24-h following treatment with RA or DMSO. e Histogram representing qRT-PCR data of Shh expression relative to Ef1α from the MB-blastema samples described in (d) (N = 5 biological replicates per sample group, *p ≤ 0.05 using the unpaired t-test, error bars are SEM). f Sample generation and treatment scheme of CALM-P samples over time (6-, 7-, or 8-days). g Histogram representing the qRT-PCR data for Shh expression relative to Ef1α in the samples described in (f) (N = 4 biological replicates, *p ≤ 0.05, **p ≤ 0.01 using the unpaired t-test, error bars are SEM). h Experimental set up to document RARE-eGFP reporter expression in ND-A wounds (N = 15 animals per group). i Representative live image (Green fluorescent channel overlayed on brightfield) time-courses of RA (top) and DMSO (bottom) treated ND-A’s from 3- to 6-days post-surgery. Wound edge is indicated with black dotted line and nerve bundle is highlighted (when visible) with yellow dotted line. Blue arrows indicate groups of GFP+ cells in ND-wound site visible starting at 5-days post ND-surgery.
Fig. 3
Fig. 3. Patterning competency is specific to undifferentiated blastema tissue.
a Experimental set-up to analyze the expressional responses of different-staged amputation blastemas when treated with RA or DMSO (early bud (EB), apical late bud (Ap. LB), basal LB (Ba. LB), and mature (Mat.) tissue treated with either RA or DMSO via qRT-PCR. Red lines indicate the locations of amputations. Blue line represents the border between the basal and apical regions of the LB blastema. b Histograms representing the qRT-PCR data of Shh, Alx4, Fgf8, and Meis2 (normalized to Ef1a expression) in treated mature (Mat.), EB, apical-LB (Ap. LB), and basal-LB (Ba.-LB) blastemas (N = 4–6 biological replicates, using the Unpaired t-test relative to EB, *p ≤ 0.05, **p ≤ 0.01, ***p ≤ 0.001, error bars are SEM). c Description of CALM-P treatment scheme and sample generation following an upper-arm denervation surgery (red line) or sham surgery. d Histogram representing the qRT-PCR data of the relative expression of Shh (normalized to Ef1a expression) in the CALM-P samples described in “C”. “S” indicates sham surgery samples, “D” indicates denervated samples. (N = 5 biological replicates, using the Unpaired t-test, *p < 0.05, error bars are SEM). e Description of near-wound denervated (red line) CALM-A treatment scheme and sample generation. f Histogram representing the % total of CALM-A surgeries that led to different ectopic growth responses in sham (S) and near-wound denervated (D) CALM-A blastemas treated with RA (+) or DMSO (−) (N = 20 biological replicates per sample—refer to Supplementary Data 1.1).
Fig. 4
Fig. 4. H3K27me3 abundance differences in uninjured, wounded, and patterning competent limb tissues.
a Sample generation scheme for H3K27me3 ChIP-sequencing analysis. b Heatmap of normalized enrichment scores of GO Biological Process Terms from Gene Set Enrichment Analysis (GSEA) in comparisons of H3K27me3 ChIP-seq data from Wound (W) relative to Mature (Mat.) and ND-A relative to Wound samples. Arrows indicate the direction of each comparison (refer to Supplementary Data 2.1). Data is segregated into four clusters (black circles 1–4) using K-means clustering. c Heat map of log2 fold change (log2FC) values of statistically significant genes that were pathway enriched in the GSEA. Limb patterning genes are indicated with blue font (refer to Supplementary Data 2.4). d Heatmap of log2FC values of limb patterning genes with statistically significant differences in H3K27me3 enrichment in each comparison (refer to Supplementary Data 2.5-2.6). e, f Heatmaps of log2FC values of cell cycle and immune and stress response-related genes with statistically significant differences in H3K27me3 enrichment in each comparison (full data sets and gene lists located in Supplementary Data 2.5 and 2.7-2.8). The top 2 most significant genes in each cluster are indicated in bold.
Fig. 5
Fig. 5. Determining the sufficiency and requirement of FGF and BMP in induction of patterning competency and associated H3K27me3 patterns.
a Treatment scheme of lateral limb wound samples: wounds were treated with beads soaked in different combinations of FGF and BMP growth factors (GF-Bead) and 7-days (7D) later injected with RA. Subsequently, wounds were evaluated for patterning competency as in the CALM. b Histograms of qRT-PCR data of relative Alx4 and Shh expression in treated wounds described in (a) (GF-Beads: PBS control, FGF2 + FGF8 (F2F8), BMP2 + FGF8 (B2F8), and BMP2 + FGF2 + FGF8 (B2FF)). Gene expression is relative to Ef1α (N = 3 biological replicates per sample group; black * indicates significant change in expression relative to PBS treated wounds using the unpaired t-test, *p < 0.05,**p < 0.005, error bares are SEM). c Images of ectopic growth limb phenotypes in the GF-Bead treated lateral wounds (described in a) 9–12 weeks following RA treatment (scale = 2 mm). N = 20–28 biological replicates for each sample group—refer to Supplementary Data 1.2. d FGF and BMP inhibitor treatment scheme for ND-A tissue. e Heat map representing qRT-PCR data of the relative expression of BMP- (Msx1 and Msx2) and FGF- (Prrx1) dependent genes (normalized to Ef1a expression) in the inhibitor treated ND-As (described in d) relative to uninjured limb tissue. Samples are labeled as follows: (+) = DMSO control, BMPi = LDN193189, FGFI = SU5402, BMPi + FGFi = cotreated with LDN193189 and SU5402. N = 3–5 biological replicates per sample group, black * indicates significant difference in expression relative to DMSO (+) treated ND-A using the Mann–Whitney t-test, *p < 0.05). f (right) Heat map of Normalized Enrichment Scores of GO Biological Process Terms from Gene Set Enrichment Analysis (GSEA) of H3K27me3 CUT&RUN data from the treated ND-As relative to DMSO treated ND-As (full gene lists and GOBP lists are provided in Supplementary Data 3.1-6). Scale bar indicates log2FC in H3K27me3 enrichment. K-means clustering identified 6 clusters (black circles 1–6). (right) Plots of the enrichment scores for the top pathway enrichment hits from the ND-A samples treated with both BMP and FGF inhibitors within the three largest clusters. g Log2FC values of 30 most significant “Additive” genomic regions (flipped enrichment trend only with both inhibitors) in the treated ND-As relative to A-lateral wounds. The top 5 most significant gene regions are indicated in bold font. h List of the top 5 GO Biological Processes from the PANTHER Overrepresentation Test (release 20230705) of “Additive” genomic regions. Full gene lists and associated PANTHER analysis are provided in Supplementary Data 3.13-14.
Fig. 6
Fig. 6. FGF and BMP dependent changes in H3K27me3 enrichment on limb patterning gene regions.
a Simplified gene maps of genes associated with A/P, D/V, and Pr/Di limb patterning where the general locations of regions with significant nerve-dependent changes in H3K27me3 enrichment are compared to lateral wounds are indicated with rectangles. Green boxes indicate regions that flipped enrichment trend in FGFi (LND193189) treated ND-As compared to DMSO treated. Pink boxes indicate regions that flipped enrichment trend in BMPi (SU5402) treated ND-As compared to DMSO treated. Yellow boxes indicate regions that either had additive or co-dependent changes in inhibitor treated samples. Orange boxes indicate regions that exhibited changes in enrichment in the inhibitor groups that do not fit with the above definitions. Gray boxes indicate changes in enrichment that occur independently of FGF and BMP signaling. Numbered white rectangles indicate promoters (P) and exons (1-1+n). b Heat maps of log2FC values for regions in which differential H3K27me3 abundance were detected in limb patterning genes associated with Anterior-Posterior, Dorsal-Ventral, and Proximal-Distal limb patterning in ND-A samples compared to lateral wounds. Regions are displayed in 5’ to 3’ order. Complete data used to generate a and (b) provided in Supplementary Data 6.

References

    1. Douglas, B. S. Conservative management of guillotine amputation of the finger in children. J. Paediatr. Child Health8, 86–89 (1972). - DOI - PubMed
    1. Illingworth, C. M. Trapped fingers and amputated finger tips in children. J. Pediatr. Surg.9, 853–858 (1974). - DOI - PubMed
    1. Yu, L. et al. BMP9 stimulates joint regeneration at digit amputation wounds in mice. Nat. Commun.10, 1–9 (2019). - PMC - PubMed
    1. Wu, Y. et al. Connective tissue fibroblast properties are position-dependent during mouse digit tip regeneration. PLoS ONE8, e54764 (2013). - DOI - PMC - PubMed
    1. Storer, M. A. et al. Acquisition of a unique mesenchymal precursor-like blastema state underlies successful adult mammalian digit tip regeneration. Dev. Cell52, 509–524.e9 (2020). - PubMed

LinkOut - more resources