. 2025 Apr 24;23(1):107.
doi: 10.1186/s12915-025-02211-0.

Single-nucleus RNA sequencing defines adipose tissue subpopulations that contribute to Tibetan pig cold adaptation

Affiliations

Single-nucleus RNA sequencing defines adipose tissue subpopulations that contribute to Tibetan pig cold adaptation

Jiali Liu et al. BMC Biol. .

Abstract

Background: Thermogenic beige adipocyte displays a remarkable ability in mammals to adapt to cold environments, but the underlying cellular mechanisms remain unclear, especially in pigs that lack functional UCP1.

Results: Multilocular beige adipocytes were observed in both Tibetan pigs (cold-tolerant) and Bama pigs (cold-sensitive) after short-term cold exposure (4 ℃ for 3 days). Through single-nucleus RNA sequencing of adipose tissues, including subcutaneous inguinal adipose tissues (IAT) and perirenal adipose tissues (PAT), from both pig breeds at room temperature and cold treatment conditions, we discovered two cell subpopulations specific to Tibetan pigs, PDGFRα+EBF2High in IAT and ADIPOQ+HIF1AHigh in both depots. PDGFRα+EBF2High cells were characterized as potential beige precursors, while ADIPOQ+HIF1AHigh cells were found to express highly thermogenic-related genes. Despite the decrease of the lipogenic subpopulation and the increase of the lipolytic and the thermogenic subpopulations observed in both pig breeds upon cold treatment, Tibetan pigs exhibited stronger cellular and molecular responses compared to Bama pigs. Remarkably, cold-induced de novo beige adipogenesis and white adipocyte browning, likely occurred in Tibetan pigs, while Bama pigs relied more heavily on white browning. Moreover, BMP7, which was highly expressed in the PDGFRα+EBF2High subpopulation, positively regulates porcine beige thermogenic capacity.

Conclusions: Our data offers a comprehensive and unprecedented perspective on the heterogeneity and plasticity of adipose tissues of pigs and broadens the understanding of beige fat biology in mammals.

Keywords: Adipocytes; Cold stimulation; Pig; Subpopulations; snRNA-seq.


Conflict of interest statement

Declarations. Ethics approval and consent to participate: All experiments involving pigs were conducted according to the guidelines for the care and use of laboratory animals established by the Beijing Association for Laboratory Animal Science and approved by the Animal Ethics Committee of the Institute of Animal Science (IAS2020 - 21), Chinese Academy of Agricultural Science. Consent for publication: Not applicable. Competing interests: The authors declare no competing interests.

Figures

Fig. 1
Fig. 1
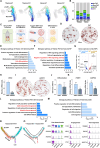
Multilocular adipocytes were observed in adipose tissues from both Tibetan and Bama pigs upon short-term cold exposure. A Schematic representation of the experimental design. B H&E staining of IAT and PAT from both Bama pigs and Tibetan pigs under RT and short-term cold stimulation. Note that multilocular adipocytes were observed in adipose tissues from both pigs upon cold exposure. C Immunohistochemistry for beige marker gene, CD137
Fig. 2
Fig. 2
Single nucleus atlas of pig adipose tissue. A The UMAP plot unveiled a comprehensive depiction of cellular heterogeneity, distinguishing a total of 19 discrete cell clusters corresponding to the 8 principal cell types. Different colors representing different cell clusters are displayed in the right panel, and the cell number for each cluster is listed in brackets. B A bubble heatmap was constructed to illustrate the distribution of marker genes across the cell types delineated in A. The dot size within the heatmap corresponds to the proportion of cells expressing a particular gene, while the color intensity denotes the relative level of gene expression. C Differential gene expression analysis showing up-regulated and down-regulated genes across all subpopulations of FAP. An adjusted p value < 0.01 and average Log2FC > 0.25 are indicated in red, while an adjusted p value < 0.01 and average Log2FC < − 0.25 are indicated in blue. D A heatmap is presented, showcasing the scaled average expression levels of marker genes specific to each subpopulation of FAPs. Annotation of subpopulations of FAP and AD. E Differential gene expression analysis showing up-regulated and down-regulated genes across all subpopulations of AD. F A heatmap is presented, showcasing the scaled average expression levels of marker genes specific to each subpopulation of ADs. G Developmental trajectory of FAP and AD lineages along pseudotime, cells were color-coded with subpopulations identified by Seurat. H Annotation of subpopulations of FAP and AD
Fig. 3
Fig. 3
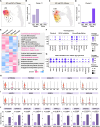
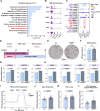
Depot-specific features of FAP subpopulations in Bama and Tibetan pigs. A UMAP projections of FAPs split by depot and breed. B Bar charts showing the proportions of FAP subpopulations between different samples in RT. C Schematic representation of the experimental design. D Representative images of differentiated adipocytes from IAT and PAT SVFs. SVFs were differentiated for 8 days under adipogenic conditions. Scale bar, 200 μm. E Gene enrichment analysis of Tibetan-IAT-derived pluFAPs. F Gene enrichment analysis of Tibetan-PAT-derived pluFAPs. G Volcano plot showing differentially expressed genes between Tibetan IAT and PAT-derived pluFAPs. H mRNA levels of DKK3 in Tibetan-PAT-derived SVFs with siRNA for NC or DKK3, n = 4. I Representative images of differentiated adipocytes from PAT-derived SVFs with siRNA for NC or DKK3. SVFs were differentiated for 8 days under adipogenic conditions. Scale bar, 200 μm. J Quantitative assessment of the Oil Red O staining data, as displayed in I, was conducted through OD measurements. K mRNA levels of adipocyte markers in differentiated adipocytes. n = 5. Data are represented as the mean ± SEM. Significance was determined using Student’s t-test. *p < 0.05, **p < 0.01, ***p < 0.001. L Gene enrichment analysis of Tibetan PAT-derived preADs. M Gene enrichment analysis of Tibetan IAT-derived preADs. N Developmental trajectory of FAP cell lineage in Tibetan IAT and PAT along pseudotime. Cells were color-coded with cell types identified by Seurat. O Cells were color-coded with IAT or PAT. P Violin plots showing gene expression levels of marker genes in C12
Fig. 4
Fig. 4
Breed-specific features of AD subpopulations in Bama and Tibetan pigs. A, C UMAP projections of adipocytes split by breeds. B, D The fraction (relative to the total number of all nuclei) of C11 (B) and C9 (D) in IAT and PAT of Tibetan and Bama pigs. E Heatmap showing scaled average expression of C11 and C9 subpopulations highly expressed genes for each subpopulation (left panel). Gene enrichment analysis of C11 and C9 (right panel). F Expression of genes associated with thermogenesis, marker genes of brown/beige adipocytes across C11 and C9. G Expression of PSGs identified in the Tibetan genomes across C11 and C9. H, I The violin plot of representative marker genes for C11. J Relative expression levels of marker genes for C11 in Tibetan and Bama pigs. Data are shown as the mean ± SEM. Significance was determined using Student’s t-test, n = 6
Fig. 5
Fig. 5
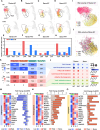
Cold induces a stronger cellular remodeling and transcriptional response in the adipose tissues of Tibetan pigs. AD UMAP plots of AD from IAT and PAT of Tibetan/Bama pigs treated with cold stress for 3 days or at RT. EH The fraction (relative to the total number of AD nuclei) of LGA, TGA, and LYA in IAT and PAT of Tibetan and Bama pigs. IJ RNA velocity analysis of AD clusters onto the UMAP plot. The direction of state transitions and the extent of change in RNA dynamics are indicated by the vectors (arrows) and their lengths. K The number of DEGs (heatmap) between RT and cold that are upregulated (red) or downregulated (blue) in three subpopulations from IAT and PAT of Tibetan/Bama pigs. L Gene ontology of downregulated DEGs in LGA and upregulated DEGs in TGA and LYA. M Heatmap showing scaled average expression of adipogenic genes regulated by cold in the LGA subpopulation (left panel); the fold change of each gene is shown in the right panel. N Heatmap showing scaled average expression of thermogenic genes regulated by cold in the TGA subpopulation (left panel); the fold change of each gene is shown in the right panel. O Heatmap showing scaled average expression of adipocytic genes regulated by cold in the LYA subpopulation (left panel). The fold change of each gene is shown in the right panel
Fig. 6
Fig. 6
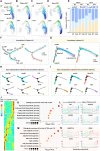
Cold stimulation may induces de novo adipogenesis in Tibetan pigs. AD UMAP plots of FAPs from the IAT and PAT of Tibetan/Bama pigs treated with cold stress for 3 days or at RT. E Bar charts showing the proportions of four cell subpopulations in the FAP between different samples. Pseudotime ordering of all FAP and AD subpopulations from the IAT of Tibetan pigs (F) or Bama pigs (G) treated with cold stress or at RT. Each dot represents one cell. The plot was color-coded with cell types (left panel). The plot was color-coded with cold stress or RT (right panel). Projection analysis of IAT of Tibetan pigs (H) or Bama pigs (I), in which subpopulations were projected onto a pseudotime process. J Heatmap illustrating the pseudotime gene expression pattern of DEGs during FAP and AD development in IAT of Tibetan pigs. GO enrichment (K) and DEGs expression dynamics (L) in gene set of the LGA fate. GO enrichment (M) and DEGs expression dynamics (N) in gene set of the TGA and LYA fate
Fig. 7
Fig. 7
BMP7 promotes porcine beige adipocyte function. A Gene enrichment analysis of marker genes in C12. B Violin plot of genes in the BMP signaling pathway for C12. C A bubble heatmap is presented, illustrating the mean attraction strength pertaining to specific ligand-receptor pairs between C12 and other FAPs. The size of each dot is indicative of the p value obtained from the permutation test, while the coloration reflects the varying levels of attraction strength. D Schematic representation of the experimental design. E Effect of the addition of rhBMP7 on beige adipocyte adipogenesis, as determined by Oil Red O staining (scale bar is 200 μm). F Quantitative analysis of the Oil Red O staining data shown in D via OD measurements, n = 4. G Expression of beige adipocyte adipogenic genes in cells treated with rhBMP7, n = 4. H Expression of beige adipocyte marker genes in cells treated with rhBMP7, n = 4. I OCR in differentiated porcine beige adipocytes treated with rhBMP7. J The basal cellular respiration was calculated. K The proton leak was calculated. The ATP production coupled respiration was calculated. The seahorse assay data were normalized to the total protein content. All data are shown as the mean ± SEM. p values were calculated by the unpaired two-tailed Student’s t-test. ns, p > 0.05
Fig. 8
Fig. 8
The origin of beige adipocytes in Tibetan and Bama pigs

Similar articles

References

    1. Cannon B, Nedergaard J. Brown adipose tissue: function and physiological significance. Physiol Rev. 2004;84(1):277–359. - PubMed
    1. Bartelt A, Heeren J. Adipose tissue browning and metabolic health. Nat Rev Endocrinol. 2014;10(1):24–36. - PubMed
    1. Chouchani ET, Kazak L, Spiegelman BM. New advances in adaptive thermogenesis: UCP1 and Beyond. Cell Metab. 2019;29(1):27–37. - PubMed
    1. Jung SM, Sanchez-Gurmaches J, Guertin DA. Brown adipose tissue development and metabolism. Handb Exp Pharmacol. 2019;251:3–36. - PMC - PubMed
    1. Berg F, Gustafson U, Andersson L. The uncoupling protein 1 gene (UCP1) is disrupted in the pig lineage: a genetic explanation for poor thermoregulation in piglets. PLoS Genet. 2006;2(8): e129. - PMC - PubMed

LinkOut - more resources