. 2025 Apr 24;23(1):240.
doi: 10.1186/s12916-025-04059-1.

Neurocognitive resilience as a predictor of psychosis onset and functional outcomes in individuals at high risk

Affiliations

Neurocognitive resilience as a predictor of psychosis onset and functional outcomes in individuals at high risk

TianHong Zhang et al. BMC Med. .

Abstract

Background: Neurocognitive resilience (NCR) refers to the ability of individuals to maintain cognitive function despite the presence of risk factors for psychosis. Investigating NCR is important as it may help predict the onset of psychosis and functional outcomes in individuals at clinical high risk (CHR) for psychosis.

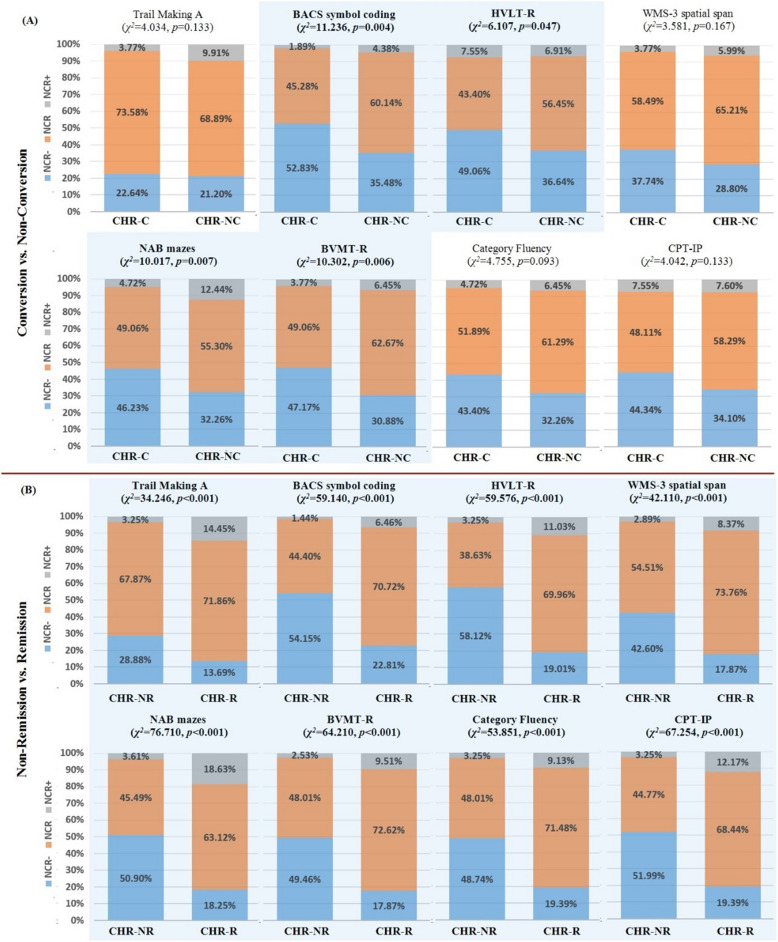
Methods: This study employed a multi-group prospective design with a 3-year follow-up as part of the ShangHai At Risk for Psychosis-Extended project. Neurocognitive performance was assessed using the Chinese version of the Measurement and Treatment Research to Improve Cognition in Schizophrenia Consensus Cognitive Battery. The study focused on two primary outcomes: conversion/non-conversion to psychosis (CHR-C/CHR-NC) and non-remission/remission (CHR-NR/CHR-R). NCR was defined based on the adjusted cognitive variable relative to the healthy control(HC) group's mean, with three categories: NCR (NCR = 0) for scores within one standard deviation, NCR + (NCR = 1) for scores more than one standard deviation above, and NCR - (NCR = - 1) for scores more than one standard deviation below.

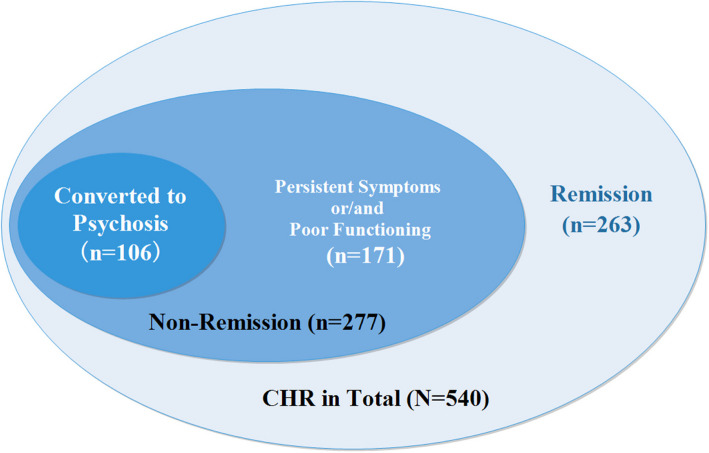
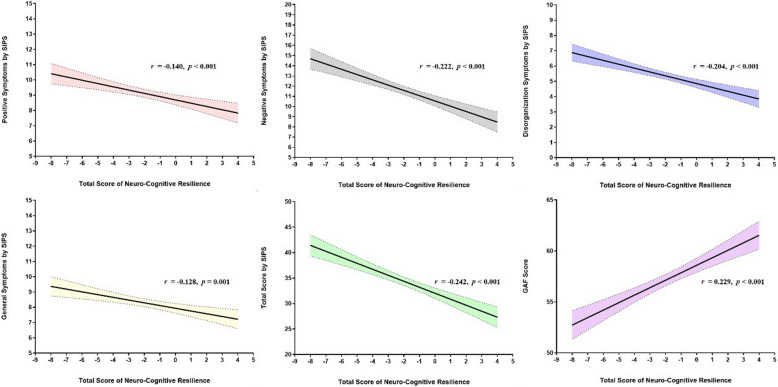
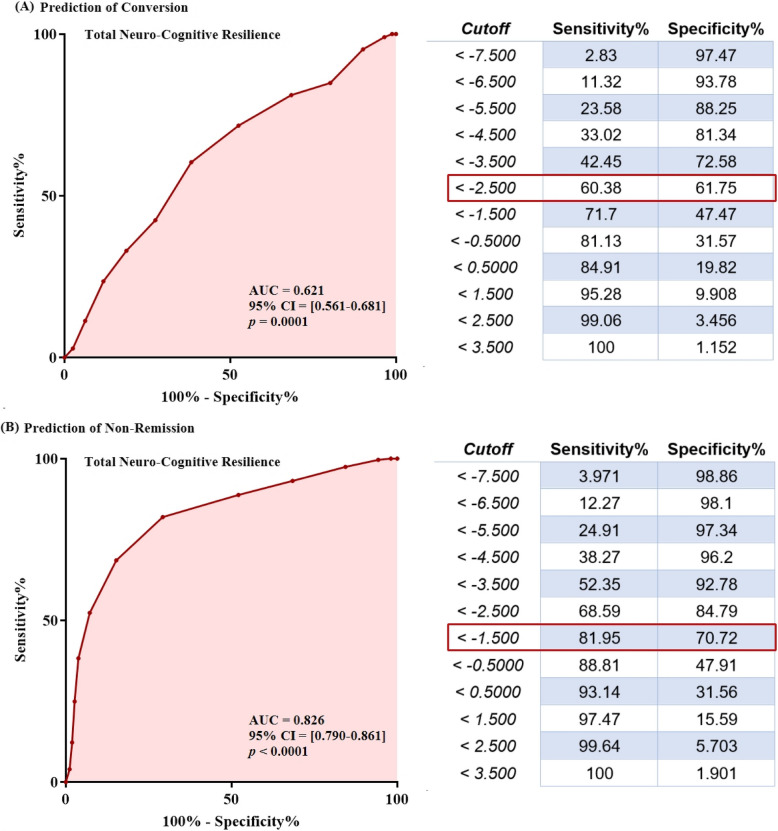
Results: The study included 771 individuals at CHR (346 males, mean age 18.8 years) and 764 HCs (359 males, mean age 22.5 years). Among the CHR participants, 540 (70.0%) completed the 3-year follow-up, with 106 (19.6%) converting to psychosis (CHR-C) and 277 (51.3%) classified as non-remission (CHR-NR). Significant negative correlations were found between the total NCR score and various clinical symptoms. Comparing CHR-C and non-converters (CHR-NC), there were notable differences in NCR distributions across four cognitive measures, with a higher proportion of CHR-C individuals categorized as NCR - . For CHR-NR versus remission (CHR-R), CHR-NR individuals were more likely to be classified as NCR - across nearly all cognitive domains. The receiver operating characteristic (ROC) curve for predicting conversion to psychosis yielded an area under the curve (AUC) of 0.621 (95% CI (0.561-0.681), p = 0.0001), while the ROC for predicting non-remission demonstrated a higher AUC of 0.826 (95% CI (0.790-0.861), p < 0.0001).

Conclusions: NCR was associated with both conversion to psychosis and non-remission outcomes in CHR individuals, showing notable predictive accuracy, particularly for non-remission.

Keywords: Cognition; Functional outcome; Prodromal psychosis; Remission; Transition; Ultra high risk.


Conflict of interest statement

Declarations. Ethics approval and consent to participate: Ethical approval for the research (including the consent procedure) was granted by the Institutional Review Board of the Shanghai Mental Health Center (IRB2016-009). All participants provided written consent to be involved in the study. Consent for publication: Not applicable. Competing interests: The authors declare no competing interests.

Figures

Fig. 1
Fig. 1
Venn diagram illustrating outcome categories among CHR individuals. This Venn diagram depicts the distribution of 540 CHR (clinical high risk) individuals across three outcome categories: remission, non-remission, and conversion to psychosis. The non-remission group (n = 277) includes 106 individuals who converted to psychosis, as well as 171 individuals with persistent symptoms or poor functioning. The remission group consists of 263 individuals who have neither persistent symptoms nor poor global functioning. The overlapping and non-overlapping areas clearly show the relationships and categorization of CHR individuals based on their outcomes
Fig. 2
Fig. 2
Spearman correlations between total neurocognitive resilience (NCR) score and baseline clinical symptoms in the clinical high risk group. This figure displays six scatter-plot graphs, each illustrating the Spearman correlation between the total NCR score and a different type of baseline clinical symptom in the clinical high risk (CHR) group. The total score of NCR is calculated as the sum of the NCR values from 8 cognitive tests, where each test has NCR values of − 1, 0, or 1, resulting in a score range from − 8 to 8. Top–left graph: It shows the relationship between the total NCR score and positive symptoms as measured by the SIPS. The Spearman correlation coefficient (r) is − 0.140, with a p-value < 0.001. The negative correlation indicates that as the total NCR score increases, the level of positive symptoms tends to decrease. The shaded area around the regression line represents the confidence interval, providing an estimate of the uncertainty around the correlation. Top–middle graph: This graph depicts the correlation between the total NCR score and negative symptoms by SIPS. The r value is − 0.222, with a p-value < 0.001. Similar to the previous graph, a negative correlation is observed, suggesting that higher total NCR scores are associated with lower levels of negative symptoms. Top–right graph: It illustrates the relationship between the total NCR score and disorganization symptoms as measured by SIPS. The correlation coefficient r is − 0.204, with a p-value < 0.001, indicating an inverse relationship between the total NCR score and disorganization symptoms. Bottom–left graph: Here, the correlation between the total NCR score and general symptoms by SIPS is shown. The r value is 0.128, with a p-value < 0.001. This positive correlation implies that as the total NCR score increases, the level of general symptoms also tends to increase, though the correlation is relatively weaker compared to the negative correlations seen above. Bottom–middle graph: This graph represents the correlation between the total NCR score and the total score of SIPS. The r value is − 0.242, with a p-value < 0.001, showing a negative relationship where higher total NCR scores are associated with lower total SIPS scores. Bottom–right graph: It shows the correlation between the total NCR score and the Global Assessment of Functioning (GAF) score. The r value is 0.229, with a p-value < 0.001. A positive correlation is observed, meaning that higher total NCR scores are related to higher GAF scores, indicating better overall functioning. Note: GAF, Global Assessment of Functioning score; SIPS, Structured Interview for Prodromal Syndromes. The r refers to Spearman correlation coefficient
Fig. 3
Fig. 3
Distribution of neurocognitive resilience (NCR) categories across conversion and remission outcomes in the CHR group. A Depicts the distribution of NCR categories (NCR − , NCR, and NCR +) among CHR individuals who converted to psychosis (CHR-C) and those who did not convert (CHR-NC). The bars are color-coded, where the blue-background segments indicate the NCR categories for which the group-to-group comparisons (between CHR-C and CHR-NC) were statistically significant. The percentages within each bar show the proportion of individuals in each NCR category for the respective conversion outcome. For example, in the Trail Making A test, 22.64% of CHR-C individuals were in the NCR-category, 73.58% in the NCR category, and 3.77% in the NCR + category. Chi-square (χ2) and p-values are presented above each set of bars to quantify the significance of the differences in NCR category distributions between the two conversion outcome groups for each cognitive test. A significant p-value (p < 0.05) implies that there is a notable difference in the distribution of NCR categories between CHR-C and CHR-NC for that specific test. B Shows the distribution of NCR categories among CHR individuals who did not achieve remission (CHR-NR) and those who achieved remission (CHR-R). Similar to A, the blue-background segments highlight the NCR categories with significant group-to-group differences (between CHR-NR and CHR-R). The percentages within each bar represent the proportion of individuals in each NCR category for the respective remission outcome. For instance, in the BACS symbol coding test, 54.15% of CHR-NR individuals were in the NCR-category, 44.40% in the NCR category, and 1.45% in the NCR + category. The χ2 and p-values above each set of bars help assess whether there are significant differences in the NCR category distributions between CHR-NR and CHR-R for each cognitive test. Note: NCR (neurocognitive resilience) is defined as follows: NCR (NCR = 0): the adjusted cognitive variable is within one standard deviation of the mean of the HC group. NCR + (NCR = 1): the adjusted cognitive variable is greater than one standard deviation above the mean of the HC group. NCR − (NCR = − 1): the adjusted cognitive variable is less than one standard deviation below the mean of the HC group. Abbreviations: BACS, Brief Assessment of Cognition in Schizophrenia symbol coding; BVMT-R, Brief Visuospatial Memory Test–Revised; CPT-IP, Continuous Performance Test–Identical Pairs; HVLT-R, Hopkins Verbal Learning Test–Revised; NAB, Neuropsychological Assessment Battery mazes; WMS-3, Wechsler Memory Scale–Third Edition spatial span
Fig. 4
Fig. 4
ROC curves for predicting conversion and non-remission using total neurocognitive resilience (NCR) scores. A Prediction of conversion. This panel presents a receiver operating characteristic (ROC) curve that evaluates the ability of total NCR scores to predict conversion to psychosis among CHR individuals. The curve plots the true-positive rate (sensitivity) on the y-axis against the false-positive rate (100% − Specificity) on the x-axis. The area under the curve (AUC) is 0.621, with a 95% confidence interval (CI) of (0.561–0.681) and a p-value of 0.0001, indicating that the total NCR scores have a statistically significant but modest ability to predict conversion. Adjacent to the curve is a table that lists various cutoff values for total NCR scores, along with their corresponding sensitivity and specificity percentages. For example, a cutoff value of < − 2.500 has a sensitivity of 60.38% and a specificity of 61.75% (highlighted in the table), meaning that when the total NCR score is below this value, the test correctly identifies 60.38% of the individuals who will convert to psychosis and correctly classifies 61.75% of those who will not convert. B Prediction of non-remission. The ROC curve assesses the predictive power of total NCR scores for non-remission in CHR individuals. The AUC for this curve is 0.826, with a 95% CI of (0.790–0.861) and a p-value < 0.0001, suggesting a relatively strong and statistically significant ability of total NCR scores to predict non-remission. The accompanying table provides different cutoff values for total NCR scores and their associated sensitivity and specificity values. For instance, a cutoff of < − 1.500 has a sensitivity of 81.95% and a specificity of 70.72% (highlighted), indicating that a total NCR score below this value correctly identifies 81.95% of the individuals who will not achieve remission and correctly classifies 70.72% of those who will achieve remission. Note: NCR (neurocognitive resilience) is defined as follows: NCR (NCR = 0): the adjusted cognitive variable is within one standard deviation of the mean of the HC group. NCR + (NCR = 1): the adjusted cognitive variable is greater than one standard deviation above the mean of the HC group. NCR − (NCR = − 1): the adjusted cognitive variable is less than one standard deviation below the mean of the HC group. Abbreviations: BACS, Brief Assessment of Cognition in Schizophrenia symbol coding; BVMT-R, Brief Visuospatial Memory Test–Revised; CPT-IP, Continuous Performance Test–Identical Pairs; HVLT-R, Hopkins Verbal Learning Test–Revised; NAB, Neuropsychological Assessment Battery mazes; WMS-3, Wechsler Memory Scale–Third Edition spatial span

Similar articles

Cited by

References

    1. Yung AR, McGorry PD, McFarlane CA, Jackson HJ, Patton GC, Rakkar A. Monitoring and care of young people at incipient risk of psychosis. Schizophr Bull. 1996;22(2):283–303. - PubMed
    1. Yung AR, Yuen HP, McGorry PD, Phillips LJ, Kelly D, Dell’Olio M, et al. Mapping the onset of psychosis: the Comprehensive Assessment of At-Risk Mental States. Aust N Z J Psychiatry. 2005;39(11–12):964–71. - PubMed
    1. Zhang T, Li H, Woodberry KA, Seidman LJ, Zheng L, Li H, et al. Prodromal psychosis detection in a counseling center population in China: an epidemiological and clinical study. Schizophr Res. 2014;152(2–3):391–9. - PMC - PubMed
    1. Zhang TH, Li HJ, Woodberry KA, Xu LH, Tang YY, Guo Q, et al. Two-year follow-up of a Chinese sample at clinical high risk for psychosis: timeline of symptoms, help-seeking and conversion. Epidemiol Psychiatr Sci. 2017;26(3):287–98. - PMC - PubMed
    1. Cui H, Giuliano AJ, Zhang T, Xu L, Wei Y, Tang Y, et al. Cognitive dysfunction in a psychotropic medication-naive, clinical high-risk sample from the ShangHai-At-Risk-for-Psychosis (SHARP) study: Associations with clinical outcomes. Schizophr Res. 2020;226:138–46. - PubMed

LinkOut - more resources