. 2025 Dec;17(1):2492378.
doi: 10.1080/19490976.2025.2492378. Epub 2025 Apr 24.

Bacillus coagulans ameliorates inflammatory bone loss in post-menopausal osteoporosis via modulating the "Gut-Immune-Bone" axis

Affiliations

Bacillus coagulans ameliorates inflammatory bone loss in post-menopausal osteoporosis via modulating the "Gut-Immune-Bone" axis

Leena Sapra et al. Gut Microbes. 2025 Dec.

Abstract

Osteoporosis is a systemic skeletal disease that leads to lower bone mineral density and intensifies the risk of unexpected fractures. Recently, our group reported that numerical defect in the frequencies of Bregs along with their compromised tendency to produce IL-10 cytokine further aggravates inflammatory bone loss in post-menopausal osteoporosis (PMO). Dysbiosis induced mucosal injury and leaky gut are the predominant contributors involved in the progression of inflammatory diseases including PMO. Furthermore, several evidence suggest that gut microbial composition plays a crucial role in the development and differentiation of Bregs. Nevertheless, the potential role of dysbiotic gut microbiota (GM) and Bregs under estrogen deficient PMO conditions has never been deciphered. Here, we evaluated the role of GM in the onset and progression of PMO along with its role in modulating the anti-osteoporotic potential of Bregs. We found that enhancement in the endotoxin producing bacteria and concomitant reduction in the short chain fatty acids producing bacteria, both under pre-clinical and clinical osteoporotic condition augment inflammatory bone loss. This suggests that dysbiosis of GM potentially exacerbates bone deterioration under estrogen deficient PMO conditions. Remarkably, supplementation of probiotic Bacillus coagulans significantly improved the bone mineral density, bone strength, and bone microarchitecture by modulating the anti-osteoclastogenic, immunosuppressive and immunomodulatory potential of Bregs. The present study delves deeper into the role of immune homeostasis ("Breg-Treg-Th17" cell axis) and GM profile in the pathophysiology of PMO. Altogether, findings of the present study open novel therapeutic avenues, suggesting restoration of GM composition as one of the viable therapeutic options in mitigating inflammatory bone loss under PMO conditions via modulating the "Gut-Immune-Bone" axis.

Keywords: Bacillus coagulans (BC); GUT; SCFAs; immunoporosis and bone health; osteoclast; osteoporosis; regulatory B cells.


Conflict of interest statement

No potential conflict of interest was reported by the author(s).

Figures

None
Graphical abstract
Figure 1.
Figure 1.
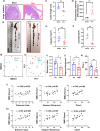
Estrogen deficiency leads to loss of gut-barrier integrity and gut dysbiosis in Ovx mice: (a) H&E staining of large intestine tissues at 20× magnification (20 µm). (b-c) Colon length. (d) Measurement of gut integrity in sham and Ovx operated mice. FITC dextran was administered orally to each experimental mice. Fluorescence intensity was measured at excitation: 488 nm and 528 nm emission as an indicative of gut integrity. (e-f) Relative gene expression of tight junctional proteins claudin-1 and occludin in the large intestine. (g) Nonmetric multidimensional scaling (NMDS) plot representing community composition of bacteria in mice fecal samples. (h) Principal component analysis (PCA) plot showing bacterial communities in human stool samples (healthy control-HC and post-menopausal osteoporosis-PMO). (i-k) Bar graph representing alpha diversity measures (Shannon Index, Simpson Reciprocal and Chao1) in human samples. (l) Spearman correlation between alpha diversity measures and femoral bone mineral density (BMD) in human samples. (m) Spearman correlation between alpha diversity measures and spine BMD in human samples. Data are expressed as mean ± SEM. Data were analyzed by unpaired student t-test. *p ≤ 0.05, **p ≤ 0.01, ***p ≤ 0.001, ****p ≤ 0.0001) compared with the indicated group.
Figure 2.
Figure 2.
Dysbiosis of GM in the PMO patients: (a) Stacked bar chart representing the top 25 relative abundance of each phylum within each group in HC and PMO patients. (b) Heatmap denoting the dominant phylum in human samples. (c) LEfSe (linear discriminant analysis effect size) identifies microbiome differences at various phylogenic levels. (d) LEfSe analysis with linear discriminant analysis (LDA) score representing statistical and biological differences in genera in between groups at genus level. (e) Pie chart and table representing the abundance of bacteria at species level in the HC and PMO patients.
Figure 3.
Figure 3.
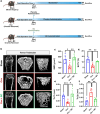
BC administration improves trabecular bone microarchitecture. (a) Schematic diagram depicting experimental design. B) 3D µCT reconstruction of femur trabecular of all groups. (b) Bone microarchitecture of femur trabecular. (c) Bone mineral density (BMD). (d) Bone volume/Tissue volume (BV/TV). (e) Trabecular thickness (Tb.Th). (f) Trabecular separation (Tb.Sp). The results were evaluated by one way ANOVA with subsequent comparisons by Student t-test for paired or unpaired data. Values are reported as mean ± SEM (n = 5). Statistical significance was considered as p ≤ 0.05 (*p ≤ 0.05, **p ≤ 0.001, ***p ≤ 0.0001) with respect to indicated mice groups.
Figure 4.
Figure 4.
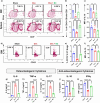
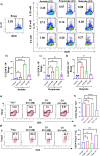
BC administration modulates Bregs in Ovx mice: (a) Contour plot representing percentage of Bregs in BM and spleen. (b) Bar graphs depicting percentage of Bregs in BM and spleen. (c) Bar graphs representing mean fluorescence intensity (MFI) of IL-10 in Bregs within BM and spleen. (d) Total CD19+IL-10+ Bregs. (e) Bar graphs representing CD19+IL-10+ Bregs. F) MFI of IL-10. (g-k) Osteoclastogenic and anti-osteoclastogenic cytokines were analyzed in serum samples of mice by ELISA. The results were evaluated by one way ANOVA with subsequent comparisons by Student t-test for paired or unpaired data. Values are reported as mean ± SEM (n = 4). Statistical significance was considered as p ≤ 0.05 (*p ≤ 0.05, **p ≤ 0.001, ***p ≤ 0.0001) with respect to indicated mice groups.
Figure 5.
Figure 5.
BC enhances the anti-osteoclastogenic potential of Bregs : (a) Experimental layout followed for the co-culture of Bregs and BMCs. (b) Photomicrographs (10X magnification) representing TRAP positive multinucleated osteoclasts. (c) Number of TRAP positive cells. (d) Number of osteoclasts with more than 3 nuclei. (e) Area of osteoclasts. The results were evaluated by one way ANOVA with subsequent comparisons by Student t-test for paired or unpaired data. Values are reported as mean ± SEM. Statistical significance was considered as p ≤ 0.05 (*p ≤ 0.05, **p ≤ 0.001, ***p ≤ 0.0001) with respect to indicated mice groups.
Figure 6.
Figure 6.
BC enhances the immunosuppressive potential of Bregs in Ovx mice: (a) Experimental layout followed for the co-culture of Bregs generated from CD19+ B cells of sham, Ovx and Ovx + BC mice with CFSE labeled T cells. (b) Histograms and pie charts representing percentage of proliferative CFSE labeled T cells in different conditions. (c) Bar graphs representing low proliferative index (LPI). (d) Bar graphs representing intermediate proliferative index (IPI). (e) Bar graphs representing high proliferative index (HPI). The results were evaluated by one way ANOVA with subsequent comparisons by Student t-test for paired or unpaired data. Values are reported as mean ± SEM. Statistical significance was considered as p ≤ 0.05 (*p ≤ 0.05, **p ≤ 0.001, ***p ≤ 0.0001) with respect to indicated mice groups.
Figure 7.
Figure 7.
BC administration enhance the inherent immunomodulatory potential of Bregs in Ovx mice: (a) Experimental layout followed for the co-culture of co-culture of Bregs generated from CD19+ B cells of Sham, Ovx and Ovx + BC mice with naïve T cells. (b) Contour plots representing percentage of CD4+Foxp3+ tregs co-cultured with S-Bregs, O-Bregs and BC-Bregs. (c) Bar graphs representing percentage of CD4+Foxp3+ Tregs. (d) Contour plots representing percentage of CD4+IL-17+ Th17 cells co-cultured with S-Bregs, O-Bregs and BC-Bregs. (e) Bar graphs representing percentage of CD4+IL-17+ Th17 cells. The results were evaluated by one way ANOVA with subsequent comparisons by Student t-test for paired or unpaired data. Values are reported as mean ± SEM. Statistical significance was considered as p ≤ 0.05 (*p ≤ 0.05, **p ≤ 0.001, ***p ≤ 0.0001) with respect to indicated mice groups.
Figure 8.
Figure 8.
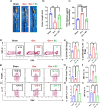
BC enhances gut integrity via modulating the “Breg-Treg-Th17” cell axis in GALT (PP): (a) Colon length of sham, Ovx and Ovx + BC mice. (b) Bar graphs representing colon length. (c) Bar graphs representing intestinal permeability in Ovx mice. (d) Contour plots depicting percentage of CD19+CD5+ Bregs in PP. (e) Bar graphs depicting percentage of CD19+CD5+ Bregs in PP. (f) Bar graphs representing percentage of CD19+CD5+IL-10+ Bregs. (g) Contour plot representing percentage of CD4+Foxp3+ Tregs in PP. (h) Bar graphs representing percentage of CD4+Foxp3+ Tregs in PP. (i) MFI of IL-10. J) contour plots depicting percentage of CD4+IL-17+ Th17 cells. (k) Bar graphs representing percentage of CD4+IL-17+ Th17 cells. l) MFI of IL-17. The results were evaluated by using ANOVA with subsequent comparisons by Student t-test for paired or unpaired data, as appropriate. Values are expressed as mean ± SEM (n = 3 or 4) and similar results were obtained in two independent experiments. Statistical significance was considered as p ≤ 0.05 (*p ≤ 0.05, **p ≤ 0.001, ***p ≤ 0.0001) with respect to indicated mice groups.
Figure 9.
Figure 9.
BC via enhancing SCFAs inhibits osteoclasts differentiation in Ovx mice: (a) For SCFAs analysis, mice were divided into 3 groups. viz. Sham, Ovx and Ovx + BC. At the end of 45 days, fecal samples are collected from all the groups of mice and analyzed for short chain fatty acids (SCFAs) with the help of high-performance liquid chromatography (HPLC). (b) Bar graphs representing the concentration of acetate, propionate, and butyrate in fecal samples of sham, Ovx, and Ovx + BC groups. (c) Photomicrographs (10X magnification) representing TRAP positive cells. (d) Number of TRAP positive cells with more than 3 nuclei and area of osteoclasts. Data are expressed as mean ± SEM. Data were analyzed by unpaired student t test and analyzed by one way ANOVA. *p ≤ 0.05, **p ≤ 0.01, ***p ≤ 0.001, ****p ≤ 0.0001) compared with the indicated group.
Figure 10.
Figure 10.
SCFAs enhance the immunomodulatory potential of Bregs: (a-d) for Bregs stimulation, splenic CD19+ B cells were negatively selected and stimulated with LPS (10µg/ml) in the presence and absence of SCFAs at different concentrations. Dot plots and bar graphs depicting the percentages of CD19+IL-10+ Bregs . (e-f) Contour plots and bar graphs are representing frequencies of Th17 cells in the presence and absence of SCFAs at different concentrations. (g-h) Contour plot and bar graphs are representing frequencies of Treg in the presence and absence of SCFAs at different concentrations. Data is represented as mean ±SEM. Similar results were obtained in two different independent experiments. Statistical significance was considered as p ≤ 0.05 (*p ≤ 0.05, **p ≤ 0.01, ***p ≤ 0.001) with respect to indicated groups.
Figure 11.
Figure 11.
Butyrate enhances bone health via modulating the “Breg-Treg-Th17” cell axis and gut integrity: (a) Experimental layout followed for the in vivo studies. (b) BMD of femoral trabecular bone. (c) BMD of LV-5 trabecular bone. (d) Bar graph representing energy. (e) Measurement of gut integrity. FITC dextran was administered orally to each experimental mouse. Fluorescence intensity was measured at excitation: 488 nm and 528 nm emission as an indicative of gut integrity. (f) Frequencies of Tregs. (g) Frequencies of Th17 cells. (h) Frequencies of CD19+CD1dhiCD5+ Bregs. (i) Frequencies of CD19+IL-10+ Bregs in the BM of mice of different groups. Data is represented as mean ±SEM (n = 4). Similar results were obtained in two different independent experiments. Statistical significance was considered as p ≤ 0.05 (*p ≤ 0.05, **p ≤ 0.01, ***p ≤ 0.001) with respect to indicated groups.
Figure 12.
Figure 12.
SCFAs inhibits osteoclastogenesis in PBMCs of HC and PMO patients : osteoclasts differentiation was induced in PBMCs of HC and PMO patients with M-CSF (30 ng/ml) and RANKL (100 ng/ml) with or without SCFAs at 0.5 mM concentration for 14 days. Giant multinucleated cells were stained with TRAP and cells with > 3 nuclei were considered as mature osteoclasts. A) photomicrographs at different magnifications (10 X and 20X) were taken. (b-c) Number of TRAP positive cells with more than 3 nuclei in HC and PMO patients. Data is represented as mean ±SEM. Mann-Whitney nonparametric test was performed for data analysis. Statistical significance was considered as p ≤ 0.05 (*p ≤ 0.05, **p ≤ 0.01, ***p ≤ 0.001) with respect to indicated groups.

References

    1. Srivastava RK, Sapra L.. The rising era of “Immunoporosis”: role of immune system in the pathophysiology of osteoporosis. J Inflamm Res [Internet]. 2022;15:1667–26. https://www.dovepress.com/the-rising-era-of-immunoporosis-role-of-immune.... - PMC - PubMed
    1. Srivastava RK, Dar HY, Mishra PK. Immunoporosis: immunology of osteoporosis—role of T cells. Front Immunol [Internet]. 2018;9. http://journal.frontiersin.org/article/10.3389/fimmu.2018.00657/full. - DOI - PMC - PubMed
    1. Woltman K, den Hoed PT. Osteoporosis in patients with a low-energy fracture: 3 years of screening in an osteoporosis outpatient clinic. J Trauma Inj Infect Crit Care [Internet]. 2010;69(1):169–173. https://journals.lww.com/00005373-201007000-00026. - PubMed
    1. Zhu X, Bai W, Zheng H. Twelve years of GWAS discoveries for osteoporosis and related traits: advances, challenges and applications. Bone Res [Internet]. 2021;9(1):23. doi: 10.1038/s41413-021-00143-3. - DOI - PMC - PubMed
    1. Sapra L, Bhardwaj A, Mishra PK, Garg B, Verma B, Mishra GC, Srivastava RK. Regulatory B cells (Bregs) inhibit osteoclastogenesis and play a potential role in ameliorating ovariectomy-induced bone loss. Front Immunol [Internet]. 2021;12. https://www.frontiersin.org/articles/10.3389/fimmu.2021.691081/full. - DOI - PMC - PubMed

LinkOut - more resources