. 2025 Jul;24(7):e70071.
doi: 10.1111/acel.70071. Epub 2025 Apr 24.

Identification of Senomorphic miRNAs in Embryonic Progenitor and Adult Stem Cell-Derived Extracellular Vesicles

Affiliations

Identification of Senomorphic miRNAs in Embryonic Progenitor and Adult Stem Cell-Derived Extracellular Vesicles

Tianpeng Zhang et al. Aging Cell. 2025 Jul.

Abstract

Extracellular vesicles (EVs) are secreted by most cell types, transmitting crucial signaling molecules like proteins, small RNAs, and DNA. We previously demonstrated that EVs from murine and human mesenchymal stem cells (MSCs) functioned as senomorphics to suppress markers of senescence and the inflammatory senescence-associated secretory phenotype (SASP) in cell culture and in aged mice. Here we demonstrate that EVs from additional types of human adult stem cells and embryonic progenitor cells have a senomorphic activity. Based on their miRNA profiles showing prevalence in stem cell EVs versus nonstem cell EVs and the number of age-related genes targeted, we identified eight miRNAs as potential senomorphic miRNAs. Analysis of these miRNAs by transfection into etoposide-induced senescent IMR90 human fibroblasts revealed that each of the miRNAs alone regulated specific senescence and SASP markers, but none had complete senomorphic activity. Evaluation of ~300 combinations of miRNAs for senotherapeutic activity identified a senomorphic cocktail of miR-181a-5p, miR-92a-3p, miR-21-5p, and miR-186-5p that markedly reduced the expression of p16INK4a, p21Cip1, IL-1β, and IL-6 and the percentage of SA-ß-gal-positive cells. Transcriptome analysis identified multiple pathways affected by the miRNA cocktail, including cellular senescence and inhibition of PCAF and HIPK2 in the p53 signaling pathway. Finally, treatment of aged mice with liposomes containing the four miRNA cocktail suppressed markers of senescence and inflammation in multiple tissues. These studies suggest that EVs derived from stem cells suppress senescence and inflammation, at least in part, through miRNAs and that a senomorphic miRNA cocktail could be used to target senescence and inflammation to extend health span.

Keywords: aging; antiaging; cellular senescence; molecular biology of aging; senescence.


Conflict of interest statement

J.L. and D.L. are employees of AgeX, G.C. is a co‐founder of Unicyte GmbH, and S.K.L. is a co‐founder of Paracrine Therapeutics. L.J.N. and P.D.R. are co‐founders of Itasca Therapeutics and inventors on several senescence‐related patents owned by the University of Minnesota.

Figures

FIGURE 1
FIGURE 1
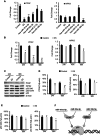
Evidence that multiple types of stem cell EVs function as senomorphics. (A) Representative image of SA‐β‐gal staining of liver sections from Ercc1 mice treated with AC83 EVs. Scale bar equals 2.5 mm. (B) Quantification of SA‐β‐gal staining of liver samples from Ercc1 mice treated with AC83 EVs. (C) qPCR analyses of p16 Ink4a , p21 Cip1 , IL‐1β, IL‐6, and Mcp‐1 of the livers from nature aging mice treated with AC83 EVs. (D) Quantification of total cell count and percentage of senescent IMR90 cells following treatment with four types of young stem cell‐derived EVs. Senescence was assessed by C12FDG SA‐β‐gal staining at 48 and 96 h posttreatment. Total cells were assessed using DAPI staining. Cell numbers are expressed as a percentage relative to untreated controls. (E, F) Relative mRNA expression of p16 Ink4a , p21 Cip1 , IL‐1β, and IL‐6 in senescent IMR90s as measured by qPCR. Data are shown as the mean ± SEM. P values are indicated with *p < 0.05 and **p < 0.01.
FIGURE 2
FIGURE 2
Identification of senomorphic miRNAs in young stem cell EVs. (A, B) Top 20 miRNAs from the miRNA profile of AC83 and HLSC. miRNAs were enriched using miEAA analysis and also scored based on the number of each miRNA targeted aging‐related genes from the GenAge database. (C) Percentage of SA‐β‐gal‐positive cells by C12FDG staining 96 h posttransfection of etoposide‐treated IMR90s with the indicated miRNAs. (D–G) Relative expression of p21 Cip1 , p16 Ink4a , IL‐1β, and IL‐6 as measured by qPCR. Data are shown as the mean ± SEM. P values are indicated with *p < 0.05 and **p < 0.01.
FIGURE 3
FIGURE 3
Identification of a senomorphic miRNA cocktail. (A) Screening of miRNA cocktails in senescent IMR90 cells. The table shows the concentration (nM) of each miRNA in different combinations (E3–E48). The heat map represents the expression levels of senescence markers (p16Ink4a, p21Cip1) and SASP factors (IL‐1β, IL‐6, Mcp‐1) by qPCR as well as the percentage of SA‐β‐gal‐positive cells at 48 and 96 h posttransfection. Blue indicates downregulation, and red indicates upregulation, with the scale showing fold‐change. (B) Expression of p16 Ink4a , p21 Cip1 , and SASPs as well as the percent of SA‐β‐gal‐positive IMR90 cells after transfection of the E5 cocktail of miRNAs. (C) IL‐6 levels in the supernatant of senescent IMR90s 96 h posttransfection with the E5 cocktail. Data are shown as the mean ± SEM. p values are indicated with *p < 0.05 and **p < 0.01.
FIGURE 4
FIGURE 4
Possible senomorphic mechanism of E5. (A) Relative expressions of PCAF and HIPK2 in senescent IMR90 cells quantitated by qPCR. (B) Expression of PCAF and HIPK2 at 24, 48, and 96 h posttransfection with E5 by qPCR. (C) Representative immunoblots showing the protein levels of PCAF, HIPK2, p53 S46 (phosphorylated p53 at Ser46), and p53 K379 (acetylated p53 at Lys379) at 24 and 96 h posttransfection with E5. (D, E) Densitometry quantification of Western blot bands. (F) A model for how the E5 miRNA cocktail inhibits p53 activity. Data are shown as the mean ± SEM. P values are indicated with *p < 0.05 and **p < 0.01.
FIGURE 5
FIGURE 5
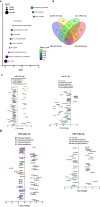
Pathways targeted by E5 cocktail. (A) Pathway enrichment analysis was conducted on RNA‐seq data using DAVID, based on the differentially expressed genes (DEGs) posttransfection with E5 cocktail. (B) Venn diagram of the unique gene expressions associated with each miRNA from the E5 cocktail. (C, D) Pathway enrichment analysis was conducted using DAVID, based on the unique gene expressions associated with each miRNA.
FIGURE 6
FIGURE 6
E5 Cocktail reduces senescence and SASP markers in naturally aged mice. (A) Endogenous expression of each miRNA in the liver of young and old mice. (B) Representative SA‐β‐gal staining images of liver section from aged mice, scale bar: 200 μm. (C) Quantification of SA‐β‐gal‐positive cells in the liver of old mice. (D) Representative immunofluorescence images showing γ‐H2AX‐positive cells in the liver of old mice (scale bar: 100 μm). (E) Quantification of γ‐H2AX‐positive cells in the liver of old mice. (F) Quantification of p16 Ink4a , p21 Cip1 , IL‐1β, IL‐6, and Mcp‐1 in the liver of aged mice. (G) Representative Western blots showing the expression levels of PCAF, HIPK2, p53, and acetylated p53 at Lys379 (p53 K379) in liver tissues of aged mice treated with the E5 cocktail or control. (H) Densitometry quantification of the Western blot bands for PCAF, HIPK2, p53, and p53 K379, normalized to β‐Actin (n = 4 per group). (I) Heatmap displaying differentially expressed genes from the SenMayo senescence gene set in the liver of aged mice treated with the E5 cocktail. (J) Gene Set Enrichment Analysis (GSEA) of liver tissue from aged mice treated with the E5 cocktail. Pathways were identified as significantly enriched based on RNA‐seq data and are displayed according to their normalized enrichment score (NES) and nominal p‐value (Nom p‐val). Data are shown as the mean ± SEM. P values are indicated with *p < 0.05 and **p < 0.01.

Similar articles

References

    1. Anisimov, V. N. , Berstein L. M., Egormin P. A., et al. 2008. “Metformin Slows Down Aging and Extends Life Span of Female SHR Mice.” Cell Cycle 7, no. 17: 2769–2773. - PubMed
    1. Ben Halima, S. , Siegel G., and Rajendran L.. 2016. “miR‐186 in Alzheimer's Disease: A Big Hope for a Small RNA?” Journal of Neurochemistry 137, no. 3: 308–311. - PubMed
    1. Bi, Y. , Qiao X., Cai Z., et al. 2025. “Exosomal miR‐302b Rejuvenates Aging Mice by Reversing the Proliferative Arrest of Senescent Cells.” Cell Metabolism 37: 527–541.e6. - PubMed
    1. Cabreiro, F. , Au C., Leung K. Y., et al. 2013. “Metformin Retards Aging in <styled-content style="fixed-case"> C. elegans </styled-content> by Altering Microbial Folate and Methionine Metabolism.” Cell 153, no. 1: 228–239. - PMC - PubMed
    1. Chen, C. , Zhou M., Ge Y., and Wang X.. 2020. “SIRT1 and Aging Related Signaling Pathways.” Mechanisms of Ageing and Development 187: 111215. - PubMed

MeSH terms

LinkOut - more resources