. 2025 Jun;24(6):e70039.
doi: 10.1111/acel.70039. Epub 2025 Apr 24.

Age-Dependent Regulation of Hippocampal Inflammation by the Mitochondrial Translocator Protein in Mice

Affiliations

Age-Dependent Regulation of Hippocampal Inflammation by the Mitochondrial Translocator Protein in Mice

Kei Onn Lai et al. Aging Cell. 2025 Jun.

Abstract

The mitochondrial translocator protein (TSPO) is a biomarker of inflammation associated with neurodegenerative diseases, widely regarded to be upregulated in the aging brain. Here we investigated the interaction between aging and TSPO immunomodulatory function in the mouse hippocampus, a region severely affected in Alzheimer's Disease (AD). Surprisingly, we found that TSPO levels were decreased in brain innate immune populations in aging. Aging resulted in a reversal of TSPO knockout transcriptional signatures following inflammatory insult. TSPO deletion drastically exacerbated inflammatory transcriptional responses in the aging hippocampus, while dampening inflammation in the young hippocampus. This age-dependent effect of TSPO was linked to NF-kβ and interferon regulatory transcriptional networks. Drugs that disrupt the cell cycle and induce DNA damage, such as heat shock protein and topoisomerase inhibitors, were identified to mimic the inflammatory transcriptional signature characterizing aging in TSPO knockout mice most closely. These findings indicate that TSPO plays a protective role in brain aging. This TSPO-aging interaction is an important consideration in the interpretation of TSPO-targeted biomarker and therapeutic studies, as well as in vitro studies that cannot model the aging brain.

Keywords: LPS; aging; hippocampus; mitochondria; neuroinflammation; translocator protein.


Conflict of interest statement

The authors declare no conflicts of interest.

Figures

FIGURE 1
FIGURE 1
Hippocampal inflammaging: Age‐associated sterile inflammation in mouse hippocampus. (A) Volcano plot showing differentially expressed genes in normal aging hippocampus (aged WT PBS versus young WT PBS). Overlapping differentially expressed genes (DEGs) between this comparison and inflammatory response in the young comparison (young WT LPS vs. young WT PBS) are identified. Specifically, overlapping DEGs that are downregulated in both comparisons are blue, while upregulated DEGs are in red. (B) Comparison of overlapping gene set enrichment pathways between normal aging and inflammatory response in the young. (C) Hypergeometric testing of DEG overlap between normal aging and inflammatory response in the young. Odds ratio represents strengths of positive association between the two DEG sets. Magnitude of odds ratio is represented by color key (blue palette) while p value scoring is labeled (red) (D) Volcano plot showing differentially expressed genes in inflammatory aging hippocampus (aged WT LPS versus young WT LPS). (E) Left: Flow cytometry quantification of TSPO protein levels in innate immune cells isolated from brain (MFI, median fluorescence intensity). Microglia (μglia): CD45hiF4/80hicd11B+; monocytes: CD45intF4/80hicd11B+Ly6c+MHCII; monocyte‐derived macrophages (MF): CD45intF4/80hicd11B+Ly6c+MHCII+. Right: Representative histogram of TSPO fluorescence in CD45+ cells isolated from WT and TSPO‐KO mouse brain. Statistical tests: 2E: Three‐way ANOVA with FDR post hoc. p < 0.05.
FIGURE 2
FIGURE 2
TSPO–aging interaction in inflammatory transcriptional responses in mouse hippocampus. (A) Volcano plot showing differentially expressed genes in aged WT versus aged TSPO‐KO hippocampus at baseline. Differentially expressed genes (DEGs) were either coded in red (significantly upregulated) or blue (significantly downregulated). Significant DEGs are thresholded at FDR < 0.05, with upregulation thresholded at Log2FC ≥ 0.5 and downregulated at Log2FC ≤ −0.5 respectively. (B) Top: Effect of TSPO deletion on proportions of brain innate immune cell populations across normal aging. Bottom: Representative gating strategy. Microglia (μglia): CD45hiF4/80hicd11B+; monocytes: CD45intF4/80hicd11B+Ly6c+MHCII; monocyte‐derived macrophages: CD45intF4/80hicd11B+Ly6c+MHCII+. (C) Volcano plot showing differentially expressed genes in aged WT versus aged TSPO‐KO hippocampus following LPS injections. Significant DEGs were thresholded at FDR < 0.05 an indicated as orange. DEGs that were reversed in aged compared to young WT versus TSPO‐KO hippocampus indicated in blue (significantly downregulated in young but upregulated in aged) and red (significantly upregulated in young, but downregulated in aged) respectively. (D) Fast gene set enrichment analysis (fGSEA) of DEGs in aged WT versus aged TSPO‐KO hippocampus following LPS treatment using Gene Ontology Biological Process pathways. Top 5 up‐ and down‐regulated enriched pathways ranked by normalized enrichment score (NES). (E) Comparison of DEG overlap between aged and young WT versus TSPO‐KO comparisons using hypergeometric testing. Odds ratio represents strengths of positive association between two DEG sets. Magnitude of odds ratio is represented by color key (blue palette) while p value scoring is labeled (red). (F) Effect of TSPO deletion on proportions of brain innate immune cell populations isolated from inflamed aging brain measured by flow cytometry. Representative gating strategy shown in (B). (G–O) Estimation of hippocampal cell‐specific contributions to transcriptional signatures detected in LPS treated WT and TSPO‐KO mice using CIBERSORTx. Units of the graphs are arbitrary. Data shown as median, interquartile range with error bars indicating minimum and maximum. Statistical tests: A, C: Benjamini–Hochberg (BH) corrected FDR < 0.05; NS, non‐significant. B: Two‐way ANOVA with FDR post hoc *p < 0.05. E: Fisher's Exact test to test. F: Two‐way ANOVA. G–O: Permutational univariate ANOVA, Dunn's multiple comparison post hoc test. **p < 0.01. *p < 0.05. Created in BioRender. https://BioRender.com/v05x181.
FIGURE 3
FIGURE 3
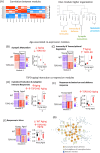
Multi WGCNA reveals co‐expression network associated with TSPO in aging and inflammaging. (A) Heatmap (left) and cluster dendrogram (right) showing inter‐module relationship among the modules detected. Representation of individual module is defined by the module eigengenes (first principal component, PC1, of each module). Heatmap is calculated from the pairwise correlation between every module eigengene, with intensity as strength of correlation. Hierarchical clustered dendrogram shows eigengene networks, which comprises of one/multiple module eigengenes. (B–E) Differential expression of modules functionally characterized by gene set enrichment analysis as (B) synaptic maturation module, (C) transcriptional and translational regulation module, (D) cytokine production & adaptive immune responses module, (E) response to bacterium and defense response module, and (F) response to virus module. For each module heatmap of expression of module members for young and aged WT and TSPO‐KO samples shown (left) and graph of module expression summarized by the module eigengene for each group shown (right). Module expression, summarized by the module eigengene, or the PC1, is shown for each group. Eigengene data boxplots are inclusive of its median and interquartile range with error bars indicating minimum and maximum. (G) Integrated transcription factor–module members network of Module 5 (module exclusively upregulated by TSPO‐KO Aged group). Edges refer to protein–protein interactions retrieved via STRING database. Orange nodes are the transcription factors whose motifs are significantly enriched (BH p‐adjusted value < 0.05) using Module 5 members as the input list to HOMER software. Yellow nodes refer to first neighbors of the transcription factors within Module 5. Transcription factors which have the highest degree connectivity (protein–protein interactions with the rest of Module 5) NF‐Kβ (e.g., Rela) and interferon transcription factors families (e.g., Irf1, Isg15). Statistical tests: A–F: Multivariate PERMANOVA, EMM post hoc test. *p < 0.05. **p = 0.02. ***p < 0.002.
FIGURE 4
FIGURE 4
Identification of small molecules that transcriptionally phenocopy TSPO‐KO hippocampal inflammaging to verify TSPO modulation of NF‐κB in senescent microglia. (A) Small molecules identified to transcriptionally phenocopy the TSPO inflammaging signature via Connectivity Mapping. Mean connectivity score against rank of LINCS compounds treated in (A) NPC and (B) GI1 cell line when queried with TSPO inflammaging signature. Positive connectivity score indicates the phenocopying effect of a compound with the query signature, while a negative score indicates the anti‐correlation between the compound and query signature. Compounds are ranked in ascending order, from the strongest phenocopy to strongest reversal signal. Green: CDK inhibitors, Pink: HSP90 inhibitors, Yellow: Topoisomerase inhibitors. (C) Quantification of median intensity of SA‐β‐Gal fluorescence signal (MFI) in cultured WT primary microglia as evaluated by staining of SA‐β‐Gal. Treatment conditions as follows: VV (Vehicle), EL (Entinostat+LPS), REL (Ro5‐4864 + Entinostat+LPS). (D) Quantification of nuclear median intensity of NF‐kβ immunoreactivity (MFI) in primary microglia. (E) Quantification of sum of total per cell NF‐kβ immunoreactivity in primary microglia. (F) Quantification of cellular morphology of the primary microglia as evaluated by whole cell sphericity. (G) Representative confocal images of primary microglia stained for DAPI (blue), NF‐kβ (red) and SA‐β‐Gal (green). Statistical test: Welch's one‐way ANOVA, FDR post hoc multiple comparisons. *p < 0.05.
FIGURE 5
FIGURE 5
Effect of TSPO deletion on nuclear NF‐kβ activation and cellular senescence in cultured aged macrophages. Immunocytochemistry and staining of SA‐β‐Gal were performed on cultured macrophages derived from aged WT and sTSPO‐KO mice. (A) Quantification of nuclear median intensity of NF‐kβ immunoreactivity (MFI). (B) Quantification of cellular senescence measured by SA‐β‐Gal fluorescence (median fluorescence intensity, MFI). (C) Representative confocal images of the cultured macrophages derived from aged WT and TSPO‐KO mice. DAPI (blue), NF‐kβ (red) and SA‐β‐Gal (green). Statistics: Welch's one‐way ANOVA, FDR post hoc multiple comparisons *p < 0.05.
FIGURE 6
FIGURE 6
Aging and TSPO alter brain metabolic profiles in inflammation. (A) Representative 1D‐NOSEY spectra of the 19 metabolites detected in young WT, old WT, young KO and old KO brain tissue samples. Metabolite assignment to NMR peaks indicated. ADP, Adenosine diphosphate; AMP, Adenosine monophosphate; ATP, Adenosine triphosphate; Cho, choline; Cr, creatine; Fum, fumarate; GABA, γ‐aminobutyrate; gln, glutamine; glu, glutamate; GPCho, glycerophosphocholine; mIno, myo‐inositol; NAA, N‐acetyl aspartate; Nam, nicotinamide; PCho, phosphocholine; Pyr, pyruvate; scyIno, scyllo‐inositol; Suc, succinate; Tau, taurine. (B) STOCSY shows high correlation (0.8) between the two singlets (red peaks) at 4.832 (identified in aged TSPO‐KO only) and 8.462 ppm, which is formic acid. The correlation suggests that peak at 4.832 could be formaldehyde. Formaldehyde in water presents structure of methanediol and it is a singlet with chemical shift ranging from 4.4–5.4 ppm (Automated Topology Builder (ATB) and Repository Version 3.0, Methanediol | CH4O2 | MD Topology | NMR | X‐Ray (uq.edu.au)). (C) Multivariate dimensionality reduction of targeted NMR metabolites using partial least squares‐discriminant analysis (PLSDA) for young and aged WT and TSPO‐KO mice under LPS‐induced inflammation. (D) Quantification of metabolites measured by NMR in young and aged brain of WT and TSPO‐KO mice under LPS‐induced inflammation. Metabolite concentrations shown as median, interquartile range with error bars indicating minimum and maximum. Metabolites that contributed the greatest variance to discrimination of the groups along PC1 are highlighted with black header (aspartate, NAM, NAD, ADP, glutamate, GABA, succinate, fumarate and phosphatidylcholine). Correlation heatmaps show precursor:product ratios as measured by Pearson's correlation, with significance threshold p < 0.05. Precursor:product metabolite ratios which showed significant changes during aging were fumarate:succinate, and glutamine:glutamate (fumarate:succinate and glutamine:glutamate significantly correlated in the young but not aged). Conversely, glutamate:GABA ratio showed significant correlation exclusively in the TSPO aged group. Created in BioRender. https://BioRender.com/q60q212.

References

    1. Abreu, A. C. , Navas M. M., Fernández C. P., Sánchez‐Santed F., and Fernández I.. 2021. “NMR‐Based Metabolomics Approach to Explore Brain Metabolic Changes Induced by Prenatal Exposure to Autism‐Inducing Chemicals.” ACS Chemical Biology 16, no. 4: 753–765. 10.1021/acschembio.1c00053. - DOI - PubMed
    1. Álvarez‐Rodríguez, L. , López‐Hoyos M., Muñoz‐Cacho P., and Martínez‐Taboada V. M.. 2012. “Aging Is Associated With Circulating Cytokine Dysregulation.” Cellular Immunology 273, no. 2: 124–132. 10.1016/j.cellimm.2012.01.001. - DOI - PubMed
    1. Ang, H. P. , Makpol S., Nasaruddin M. L., et al. 2023. “Lipopolysaccharide‐Induced Delirium‐Like Behaviour in a Rat Model of Chronic Cerebral Hypoperfusion Is Associated With Increased Indoleamine 2,3‐Dioxygenase Expression and Endotoxin Tolerance.” International Journal of Molecular Sciences 24, no. 15: 12248. 10.3390/ijms241512248. - DOI - PMC - PubMed
    1. Bader, S. , Wolf L., Milenkovic V. M., et al. 2019. “Differential Effects of TSPO Ligands on Mitochondrial Function in Mouse Microglia Cells.” Psychoneuroendocrinology 106: 65–76. 10.1016/j.psyneuen.2019.03.029. - DOI - PubMed
    1. Bahaidrah, K. A. , Alzahrani N. A., Aldhahri R. S., Mansouri R. A., and Alghamdi B. S.. 2022. “Effects of Different Lipopolysaccharide Doses on Short‐ and Long‐Term Spatial Memory and Hippocampus Morphology in an Experimental Alzheimer's Disease Model.” Clinical and Translational Neuroscience 6, no. 3: 20.

LinkOut - more resources