. 2025 Jul 24;66(6):956-970.
doi: 10.1093/pcp/pcaf041.

Natural variation in potassium deficiency responses among Arabidopsis thaliana accessions

Affiliations

Natural variation in potassium deficiency responses among Arabidopsis thaliana accessions

Nana Sugimura et al. Plant Cell Physiol. .

Abstract

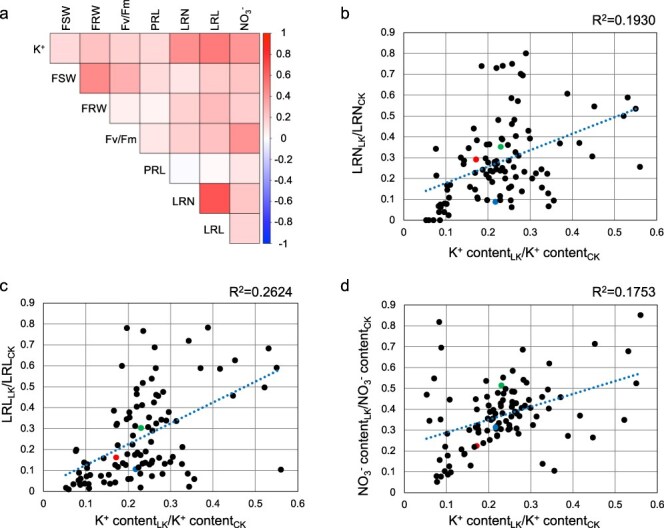
Potassium (K) is a key nutrient essential for plant growth, and its deficiency induces various adaptative responses in plants; however, the mechanisms underlying these responses remain unclear. In the present study, we explored the natural variation in K deficiency responses among 100 naturally occurring accessions of Arabidopsis thaliana and then performed a genome-wide association study (GWAS) to identify the genetic loci associated with these responses. All 100 Arabidopsis accessions showed significant differences in several traits under K deficiency, including shoot and root growth, photosynthetic activity, and inorganic ion contents. The results indicated that the reduction in K+ content due to K deficiency was correlated more significantly with decreases in the number and total length of lateral roots than with decreases in primary root length and shoot growth. Furthermore, GWAS and subsequent analyses of relevant mutants and transgenic plants suggested that several genes, which have not yet been shown to play a role in the K deficiency response, are associated with the number and/or total length of lateral roots under K deficiency. The identified genes are ROH1, NF-YA3, MAA3, and AtDTX28, which encode an exocyst subunit EXO70A1 interacting protein, an NF-Y type transcription factor, a female gametophyte development-related protein, and a MATE efflux family protein, respectively. These findings provide new insights into the mechanisms underlying K deficiency responses.

Keywords: Arabidopsis thaliana; GWAS; lateral root development; natural variation; potassium deficiency.


Conflict of interest statement

The authors have no conflicts of interest to declare.

Figures

Figure 1.
Figure 1.
Differential suppression of shoot growth due to K deficiency among 100 Arabidopsis accessions. (a) Images of the shoots of 18 Arabidopsis accessions grown on 1/2 MS agar medium for 6 days and then under control K (5 mM K) or low K (2 μM K) conditions for another 6 days. Col-0, Ler-0, and Ws-0 were used as reference accessions. Scale bar = 1 cm. (b, c) Violin plots showing the fresh shoot weight (FSW) data (b) and Fv/Fm data (c) of 100 Arabidopsis accessions under control K (CK) and low K (LK) conditions. Ratios of FSW under LK conditions to those under CK conditions (FSWLK/FSWCK) and ratios of Fv/Fm under LK conditions to those under CK conditions ([Fv/FmLK]/[Fv/FmCK]) in each accession are also shown. Each dot represents the mean of five biological replicates of an individual accession, while yellow dots indicate means. Horizontal lines indicate median and quartile deviations.
Figure 2.
Figure 2.
Differential suppression of root development due to K deficiency among 100 Arabidopsis accessions. (a) Images of the roots of Shakdara, Ove-0, Nd-1, Col-0, Li-8, and Lo-1 seedlings grown on 1/2 MS agar medium for 6 days and then under control (5 mM K) or low K (2 μM K) conditions for another 6 days. Scale bar = 1 cm. (b–e) Violin plots showing the fresh root weight (FRW) data (b), primary root length (PRL) data (c), lateral root number (LRN) data (d), and total lateral root length (LRL) data (e) of 100 Arabidopsis accessions under control K (CK) and low K (LK) conditions. Ratios of four parameters under low K (LK) conditions to those under CK conditions in each accession are also shown. Each dot represents the mean of five biological replicates of an individual accession, while yellow dots indicate means. Horizontal lines indicate median and quartile deviations.
Figure 3.
Figure 3.
K deficiency-induced changes in the inorganic ion contents of 100 Arabidopsis accessions. (a) Representative chromatograms of cations (left panels) and anions (right panel) in Col-0 seedlings exposed or not exposed to K deficiency for 6 days. The retention time for each ion is indicated. (b) Violin plots showing content data for K+ and other eight ions (Na+, NH4+, Mg2+, Ca2+, Cl, NO3, PO43−, and SO42−) of 100 Arabidopsis accessions under control K (CK) and low K (LK) conditions. Ratios of the content of each ion under low K conditions to its content under control K conditions are also shown. Each dot represents the mean of five biological replicates of an individual accession, while yellow dots indicate means. Horizontal lines indicate median and quartile deviations. (c) Correlation between the K deficiency-induced changes in K+ content and those in contents of other ions.
Figure 4.
Figure 4.
Correlation among the effects of K deficiency on different traits. (a) Heat map showing the correlation among the K deficiency-induced changes in fresh shoot weight (FSW), fresh root weight (FRW), Fv/Fm, primary root length (PRL), lateral root number (LRN), total lateral root length (LRL), and K+ and NO3 contents in Arabidopsis accessions. (b–d) Correlation between the K deficiency-induced changes in K+ content and those in LRN (B), LRL (c), and NO3 content (d). Red, blue, and green dots indicate Col-0, Ws-0, and Ler-0 accessions. Each dotted line is a linear approximation. Coefficients of determination (R2) are shown.
Figure 5.
Figure 5.
Enhanced sensitivity of nrt1.1 and nrt2.1 mutants and reduced sensitivity of the NRT1.1 overexpression (NRT1.1-OX) lines to K deficiency. (a–c) Shoots and Fv/Fm images (a), fresh shoot weight (b), and Fv/Fm (c) of wild-type (WT) Col-0, nrt1.1, nrt2.1, and NRT1.1-OX seedlings grown on 1/2 MS agar medium for 6 days and then under control or low K conditions for another 6 days. (d, e) Time-course analysis of K+ and NO3 contents in WT, nrt1.1, nrt2.1, and NRT1.1-OX seedlings during K deficiency treatment. Seedlings grown on 1/2 MS agar medium for 6 days were further grown on low K agar medium for the indicated number of days. Data in (b–e) represent the mean ± SD of six biological replicates. Asterisks above each bar indicate significant differences between WT and other samples (*P < 0.05, **P < 0.01; two-tailed Student’s t-test).
Figure 6.
Figure 6.
GWAS based on two quantitative traits representing the K deficiency response. (a, b) Manhattan plots showing the results of GWAS based on K deficiency-induced reductions in lateral root number (a) and total lateral root length (b) in 100 Arabidopsis accessions. Each dot represents a single nucleotide polymorphism (SNP) and its P-value. Peaks overlapping with SNPs located in or near the ROH1, NF-YA3, MAA3, or AtDTX28 locus (peaks a–d) are marked with a red rectangle. (c) Enlarged images of ROH1, NF-YA3, MAA3, and AtDTX28 loci and SNPs located in their vicinity.
Figure 7.
Figure 7.
Time-course analysis of ROH1, MAA3, AtDTX28, NF-YA3, HAK5, and SKOR expression levels in the shoots and roots of WT seedlings under K deficiency. WT (Col-0) seedlings initially grown on 1/2 MS agar medium for 5 days were grown under low K (10 μM K) conditions for the indicated number of days. K deficiency-responsive genes HAK5 and SKOR served as positive controls. The expression level of each gene was normalized first against the expression level of ACT2 and then against the value obtained at time zero. Data represent the mean ± SD of four biological replicates. DT, days after transition to low K conditions.
Figure 8.
Figure 8.
Root development in roh1, maa3, and atdtx28 seedlings grown under control K and low K conditions. (a) Gene structure of ROH1, MAA3, and AtDTX28. Black and gray boxes indicate coding regions and UTRs, respectively. Black horizontal lines indicate introns or the regions flanking the gene on either side. ATG and TGA or TAA represent the translation start and stop sites, respectively. The position of T-DNA insertion in each mutant, including roh1-1 (SALK_012890), roh1-2 (SALK_133970), maa3-1 (SALK_026981), maa3-2 (SALK_047075), atdtx28-1 (GK-094E09-012026), and atdtx28-2 (SALK_063441), is also indicated. (b–d) Root images (b), total lateral root length (c), and lateral root number (d) of WT (Col-0), roh1-1, roh1-2, maa3-1, maa3-2, atdtx28-1, and atdtx28-2 seedlings grown initially on 1/2 MS agar medium for 6 days and then under control K or low K conditions for another 6 days. In (c, d), data represent the mean ± SD of six biological replicates. Asterisks above each bar indicate significant differences between WT and other samples (*P < 0.05, **P < 0.01; two-tailed Student’s t-test).

References

    1. Alemán F., Nieves-Cordones M., Martínez V. and Rubio F. (2009) Differential regulation of the HAK5 genes encoding the high-affinity K+ transporters of Thellungiella halophila and Arabidopsis thaliana. Environ. Exp. Bot. 65: 263–269. doi: 10.1016/j.envexpbot.2008.09.011 - DOI
    1. Amtmann A., Hammond J.P., Armengaud P. and White P.J. (2006) Nutrient sensing and signalling in plants: potassium and phosphorus. Adv. Bot. Res. 43: 209–257.
    1. Armengaud P., Sulpice R., Mille A.J., Stitt M., Amtmann A. and Gibon Y. (2009) Multilevel analysis of primary metabolism provides new insights into the role of potassium nutrition for glycolysis and nitrogen assimilation in Arabidopsis roots. Plant Physiol. 150: 772–785. doi: 10.1104/pp.108.133629 - DOI - PMC - PubMed
    1. Bell M.J., Ransom M.D., Thompson M.L., Hinsinger P., Florence A.M., Moody P.W., et al. (2021) Considering soil potassium pools with dissimilar plant availability. Improving Potassium Recommendations for Agricultural Crops. Edited by Murrell, T.S., Mikkelsen, R.L., Sulewski, G., Norton, R. and Thompson, M.L. pp. 163–190. Springer International Publishing AG, Cham.
    1. Buelbuel S., Sakuraba Y., Sedaghatmehr M., Watanabe M., Hoefgen R., Balazadeh S., et al. (2023) Arabidopsis BBX14 negatively regulates nitrogen starvation- and dark-induced leaf senescence. Plant J. 116: 251–268. doi: 10.1111/tpj.16374 - DOI - PubMed

MeSH terms