

Two-dimensional shear wave elastography for assessing liver, spleen, and kidneys in healthy newborns
- PMID: 40276360
- PMCID: PMC12021014
- DOI: 10.15557/jou.2025.0010
Two-dimensional shear wave elastography for assessing liver, spleen, and kidneys in healthy newborns
Abstract
Aim: The aim of the study was to obtain two-dimensional shear wave elastography measurements of the liver, spleen and kidneys in healthy full-term newborns, as well as to assess its feasibility in this age group.
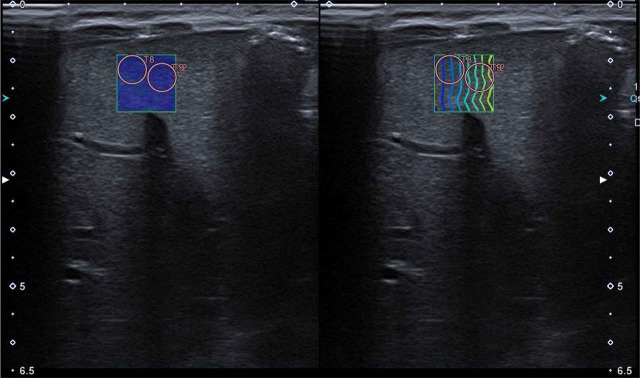
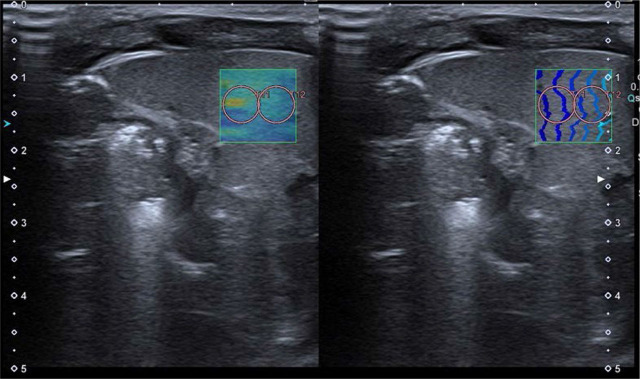
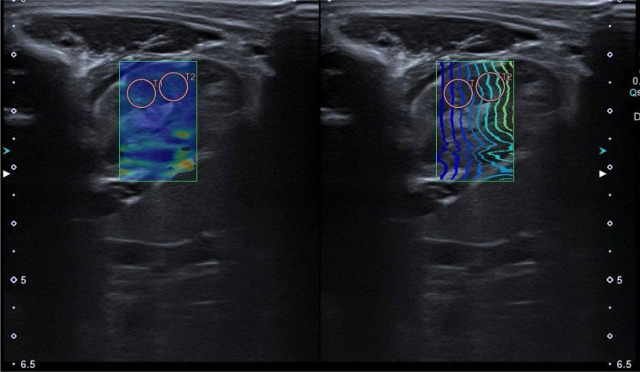
Materials and methods: We performed two-dimensional shear wave elastography of the liver, spleen and kidneys using a linear transducer at least 60 minutes after food intake in a group of 58 healthy, full-term, spontaneously breathing newborns. A series of 5 measurements using 5-mm-diameter regions of interest were performed, with the results expressed in m/s and kPa. Exam feasibility was assessed using the IQR/Median ratio as ≤30% for kPa, and ≤15% for m/s. Descriptive statistics, Shapiro-Wilk W, Levene's, Mann-Whitney U tests and Spearman correlation analysis were used for statistical assessment.
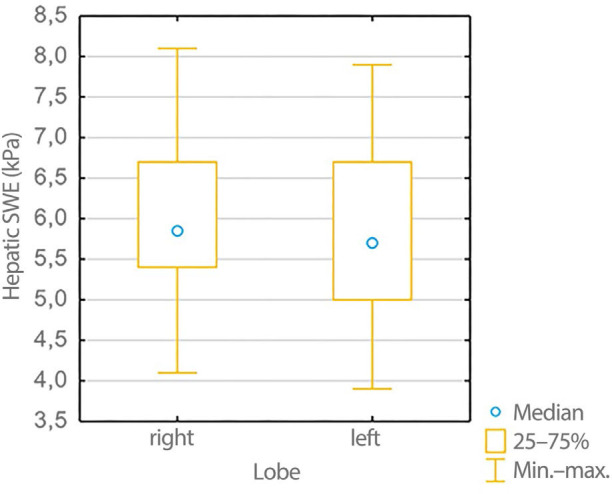
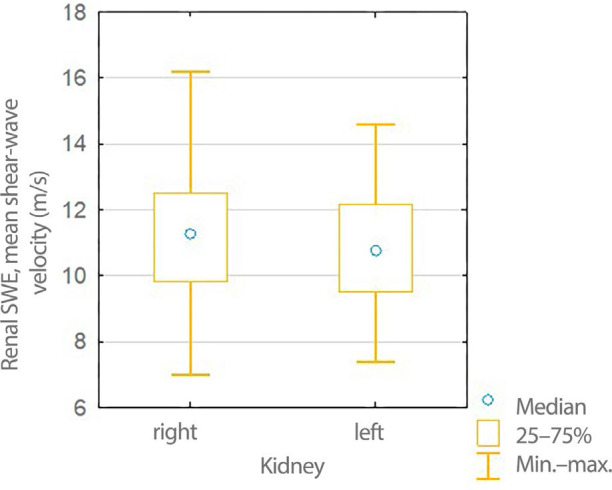
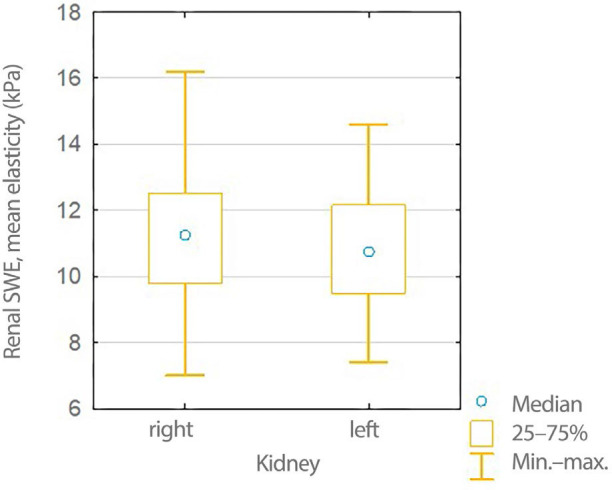
Results: The feasibility of the exam was 68.97% for the right liver lobe, 67.24% for the left lobe, 91.07% for the spleen, 89.29% for the right kidney, 85.71% for the left kidney. Mean results: right liver lobe: 1.43 m/s, SD ±0.11, 6.04 kPa, SD ±0.97, left liver lobe: 1.41 m/s, SD ±0.12, 5.86 kPa, SD ±1.02, spleen: 2.36 m/s, SD ±0.21, 16.99 kPa, SD ±3.21, right kidney: 1.92 m/s, SD ±0.18, 11.34 kPa, SD ±3.21, left kidney: 1.88 m/s, SD ±0.16, 10.81 kPa, SD ±1.80. The splenic-hepatic elastography index for m/s and kPa results was as follows: mean 1.65, SD ±0.20, mean 2.82, SD ±0.73, respectively. No differences were found between the right vs left lobe of the liver, or the right vs left kidney; there was no correlation between the measurements and gender or food intake interval >60 minutes. A positive correlation was found between the results for the right and left lobe of the liver and age, and the results for the left lobe of the liver and body weight.
Conclusions: Two-dimensional shear wave elastography of the liver, spleen and kidneys can be successfully performed in healthy neonates. We obtained reliable mean shear wave elastography values for the examined organs.
Keywords: 2D-SWE elastography; kidney elasticity; liver elasticity; newborn; spleen elasticity.
© 2025 Grzegorz Postek et al., published by Sciendo.
Conflict of interest statement
Conflict of interest The authors do not report any financial or personal connections with other persons or organizations which might negatively affect the contents of this publication and/or claim authorship rights to this publication.
Figures


References
LinkOut - more resources
Full Text Sources