. 2025 Apr 16:50:305-321.
doi: 10.1016/j.bioactmat.2025.03.021. eCollection 2025 Aug.

Endothelial cell supplementation promotes xenograft revascularization during short-term ovarian tissue transplantation

Affiliations

Endothelial cell supplementation promotes xenograft revascularization during short-term ovarian tissue transplantation

Mariagiulia Spazzapan et al. Bioact Mater. .

Abstract

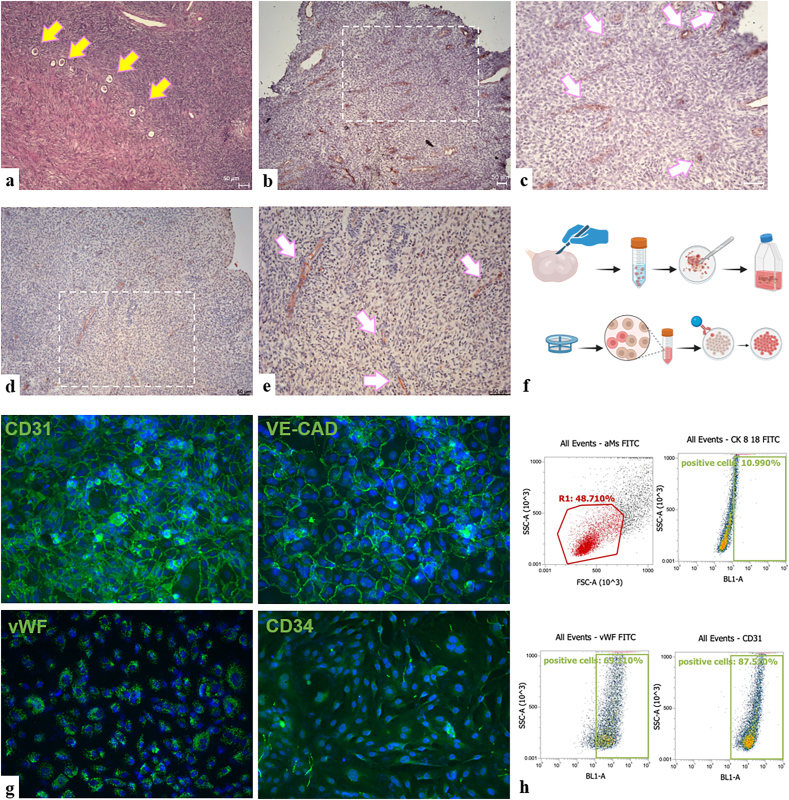
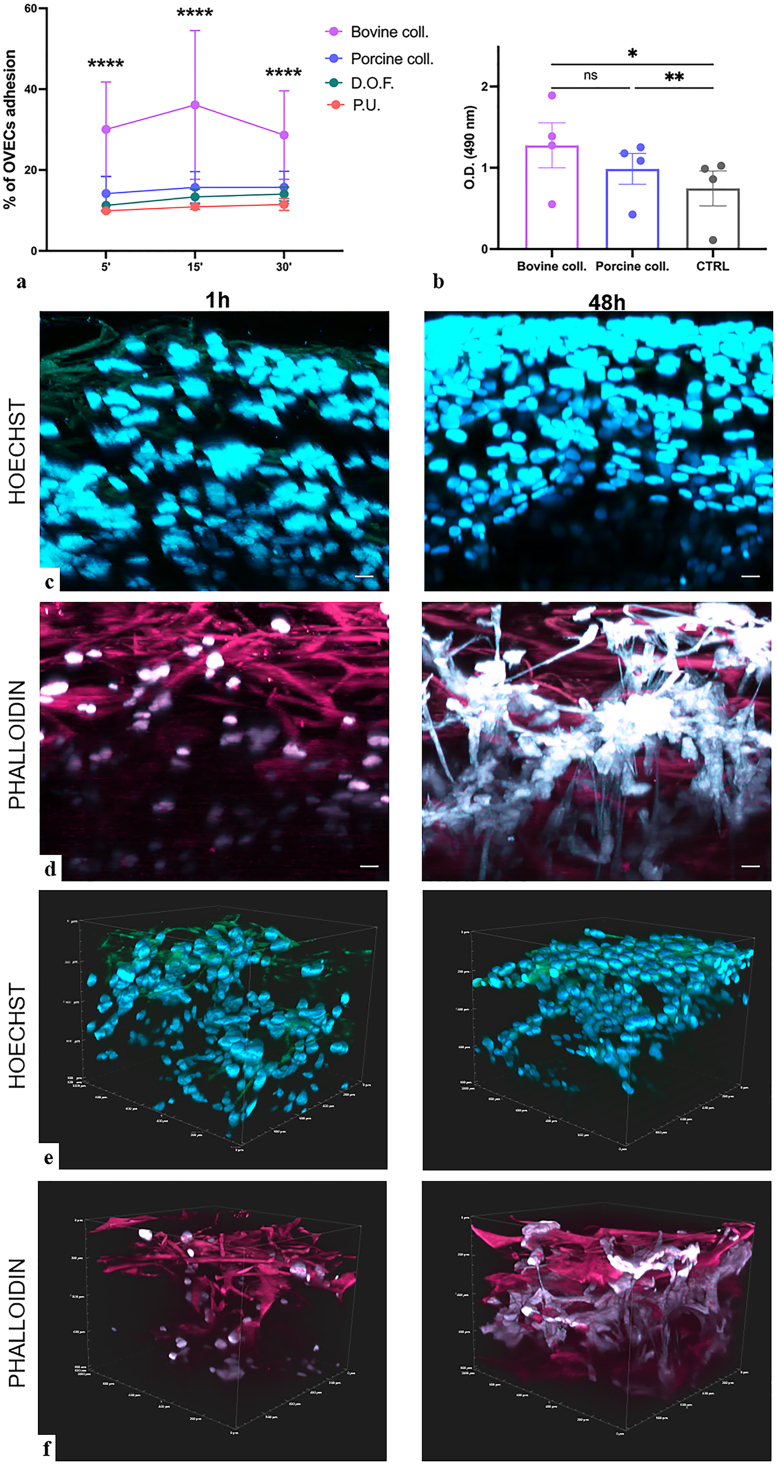
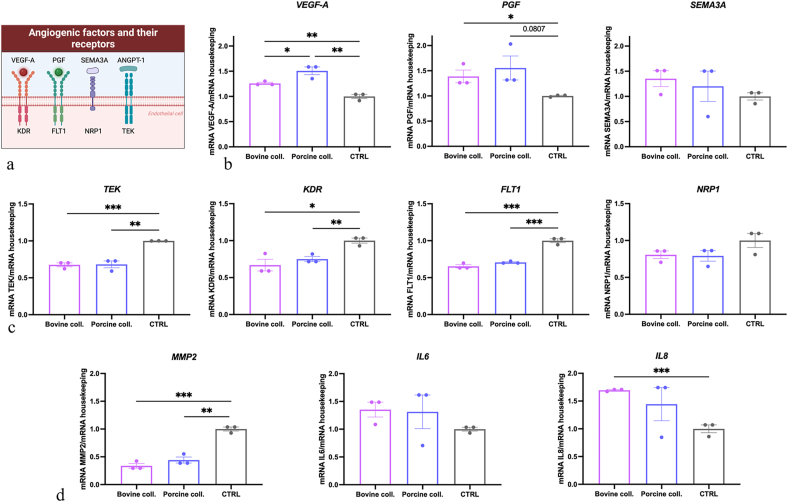
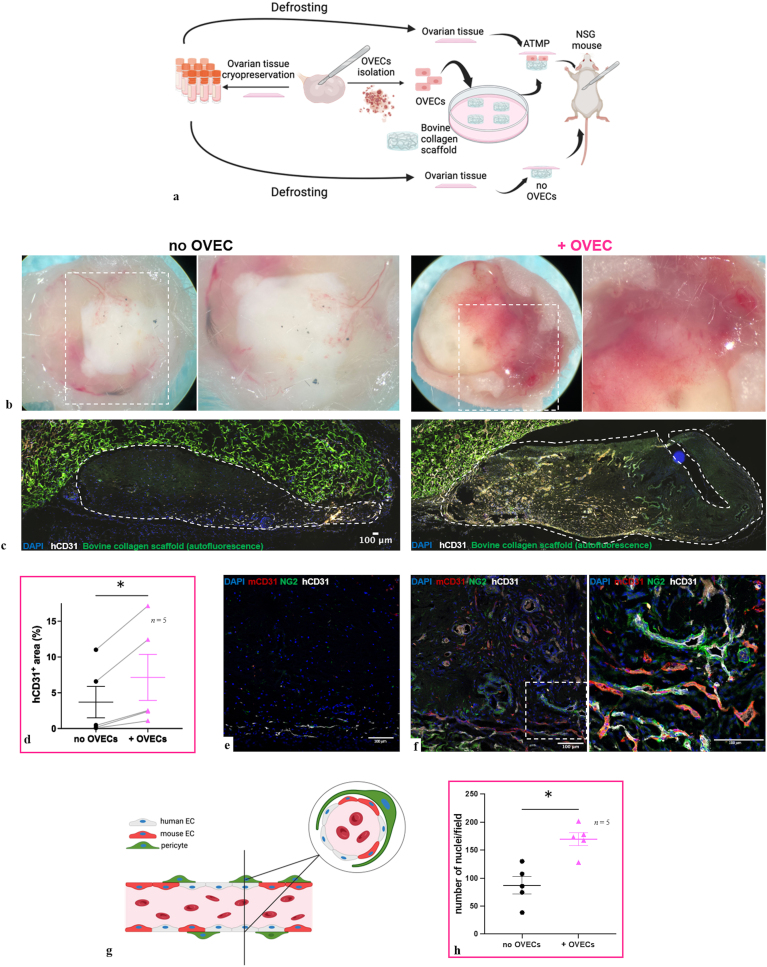
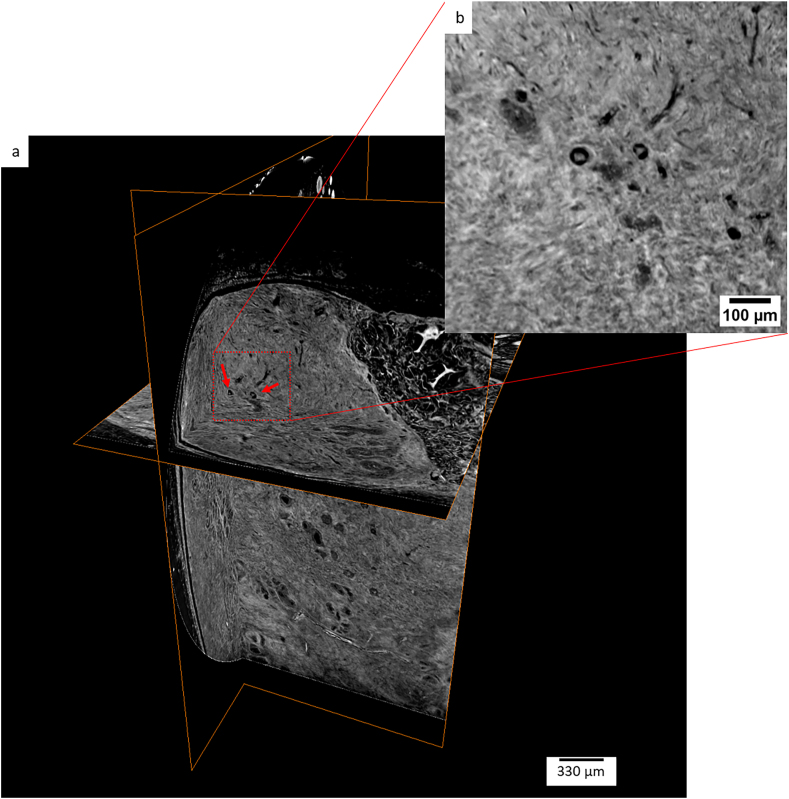
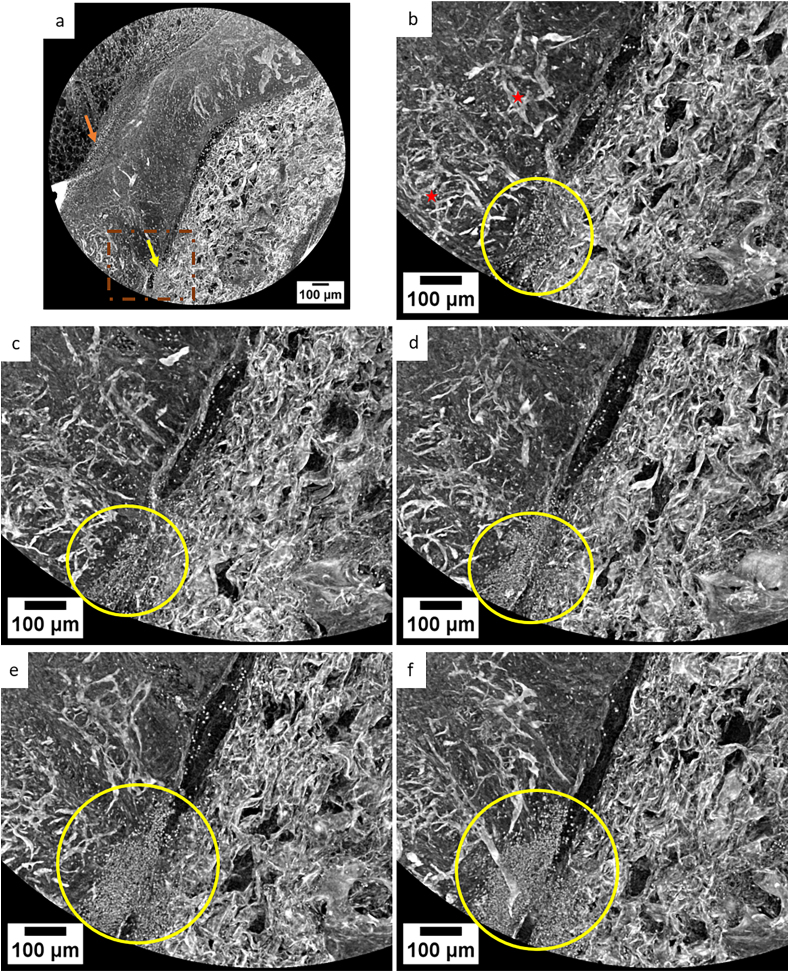
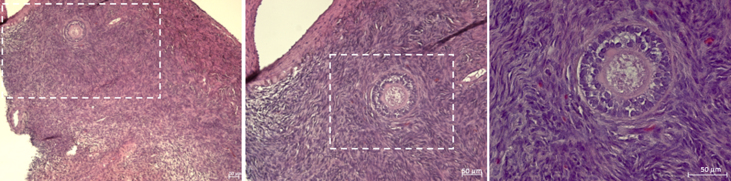
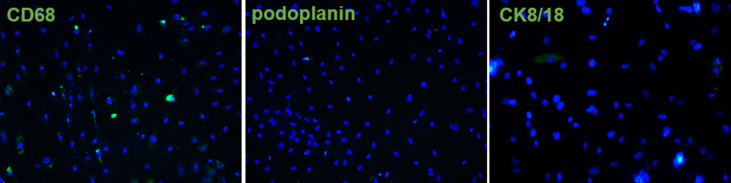
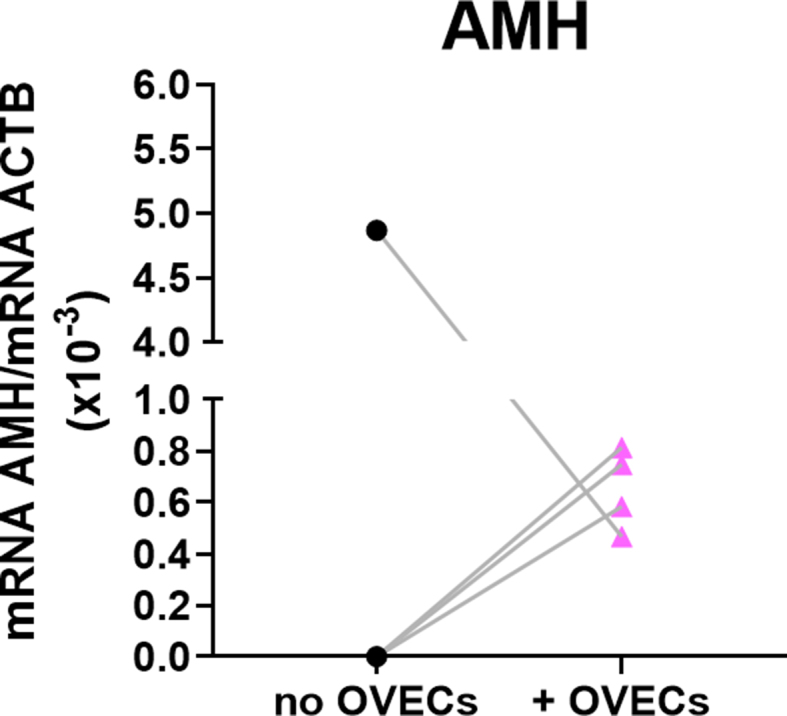
The ischemic/hypoxic window after Ovarian Tissue Transplantation (OTT) can be responsible for the loss of more than 60 % of follicles. The implantation of the tissue supplemented with endothelial cells (ECs) inside dermal substitutes represents a promising strategy for improving graft revascularization. Ovarian biopsies were partly cryopreserved and partly digested to isolate ovarian ECs (OVECs). Four dermal substitutes (Integra®, made of bovine collagen enriched with chondroitin 6-sulfate; PELNAC®, composed of porcine collagen; Myriad Matrix®, derived from decellularized ovine forestomach; and NovoSorb® BMT, a foam of polyurethane) were compared for their angiogenic bioactive properties. OVECs cultured onto the scaffolds upregulated the expression of angiogenic factors, supporting their use in boosting revascularization. Adhesion and proliferation assays suggested that the most suitable scaffold was the bovine collagen one, which was chosen for further in vivo experiments. Cryopreserved tissue was transplanted onto the 3D scaffold in immunodeficient mice with or without cell supplementation, and after 14 days, it was analyzed by immunofluorescence (IF) and X-ray phase contrast microtomography. The revascularization area of OVECs-supplemented tissue was doubled (7.14 %) compared to the scaffold transplanted alone (3.67 %). Furthermore, tissue viability, evaluated by nuclear counting, was significantly higher (mean of 169.6 nuclei/field) in the tissue grafted with OVECs than in the tissue grafted alone (mean of 87.2 nuclei/field). Overall, our findings suggest that the OVECs-supplementation shortens the ischemic interval and may significantly improve fertility preservation procedures.

Keywords: Endothelial cells; OTT mouse model; Ovarian tissue transplantation; Revascularization.


Conflict of interest statement

The authors declare no competing interests.

Figures

Image 1
Graphical Abstract
Fig. 1
Fig. 1
Histological and immunohistochemical evaluation of ovarian tissue and characterization of isolated OVECs. The presence of primordial/primary follicles was assessed by hematoxylin/eosin (a). Vessels were revealed by staining for vWF (b,c) and CD34 (d,e). (c,e) Zoomed fields of IHC staining showing a representative figure of 1 section out of 5 ovarian tissue samples (n = 5). AEC (red) chromogen was used to visualize the binding of anti-human vWF and anti-human CD34. Nuclei were stained with Mayer's Hematoxylin. Yellow arrows indicate ovarian follicles; white arrows indicate ovarian vessels. Magnification, 10× (a,b,d); 20x (c,e). Scale bars, 50 μm. Schematic representation of OVEC isolation protocol (f) and characterization for endothelial markers by IF (g). Cells were grown to confluence in eight-chamber culture slides. After fixation and permeabilization, cells were stained with mAb anti-human CD31/PECAM-1, VE-cadherin, vWF, and CD34, followed by anti-mouse-Alexa Fluor™ 488 or anti-rabbit-Alexa Fluor™ 488 secondary antibodies. Nuclei were stained by DAPI (blue). Original magnification, 20×. The same antibodies were used to confirm IF results by flow cytometry. Representative results of cytofluorimetric analyses (h) for CD31/PECAM-1, vWF, and CK8/18, or secondary antibodies only (anti-mouse FITC).
Fig. 2
Fig. 2
Interaction between OVECs and different ADMs. (a) The adhesion assay was performed by seeding FAST DiI-labeled OVECs onto the different ADMs for 5, 15, or 30 min. After removing non-adherent cells, OVECs were lysed to release the dye in solution, and the fluorescence was read. Results are expressed as percentage of cell adhesion with reference to a calibration curve established with an increasing number of labeled cells. Data are presented as mean ± standard error mean (SEM) of independent experiments conducted in duplicate (n = 3). ∗∗∗∗p < 0.0001 (Two-way ANOVA). (b) The proliferation assay was conducted by seeding OVECs onto the scaffolds for 72 h. MTS was then added, and the absorbance was read at 490 nm by a plate reading spectrophotometer. Results are presented as the mean ± SEM of independent experiments conducted in duplicate (n = 4). Cells cultured onto fibronectin were used as control (CTRL). ∗p < 0.05; ∗∗p < 0.01 (one-way ANOVA). (c-f) Multiphoton microscopy imaging of OVECs seeded onto bovine collagen scaffold for 1 h or 48 h. Nuclei were stained with HOECHST (blue) (c). 48 h after the seeding, cells were more abundant compared to cells fixed after 1 h, indicating they proliferated. Phalloidin staining (light pink) (d) and 3D reconstruction (f) highlighted that OVECs after 48 h were more spread compared to the initial timing (1 h). Scale bars, 50 μm. Bovine collagen scaffolds are represented in green (c) and bright pink (f). Representative images were taken with A1R MP confocal multiphoton microscope (Nikon).
Fig. 3
Fig. 3
Gene expression modulation of the main factors involved in the angiogenic process. (a) Schematic representation of angiogenic factors and their respective receptors. RT-qPCR of VEGFA, PGF, SEMA3A (b), KDR, FLT1, NRP1, TEK (c), MMP2, IL6, and IL8 (d) expressed by OVECs seeded onto bovine or porcine collagen scaffolds, or fibronectin (CTRL) for 48 h. The gene expression levels are reported as fold of increase with respect to the mean of normalized values of GAPDH and TBP (housekeeping genes). Data are expressed as the mean ± standard error mean of independent experiments conducted in duplicate (n = 3). ∗p < 0.05; ∗∗p < 0.01; ∗∗∗p < 0.001 (unpaired two-tailed t-test).
Fig. 4
Fig. 4
Schematic visualization of the experimental design, macroscopic results, and histological evaluation. (a) Ovarian biopsy was partly cut into tissue slices for vitrification and partly digested for OVEC isolation. OVECs were seeded onto the bovine collagen scaffold and transplanted in the back of female NSG mice. (b) After 14 days, the macroscopic evaluation of the excised grafts indicated a higher vascularization of the graft supplemented with OVECs compared to the tissue grafted alone. (c) IF for hCD31 (white) of excised graft with or without OVECs supplementation. Bovine collagen scaffold presents a characteristic autofluorescence in the green channel. Images were acquired using a Nikon Eclipse Ti-E inverted fluorescent microscope equipped with a DC-152Q-C00-FI and NIS V4.30 software (Nikon), as well as a ZEISS LSM 880 with Airyscan. Stitched images were acquired using NIS V4.30 software (Nikon). (d) Quantification of the area positive for hCD31 normalized on the area of human ovarian tissue (dotted area). Data are represented as the mean ± standard error mean (SEM) of independent experiments (n = 5). ∗p < 0.05 (paired two-tailed t-test). (e, f left panel) IF staining of mouse CD31 (mCD31; red), human CD31 (hCD31; grey), and NG2 (green) showed that graft supplementation with OVECs resulted in the formation of mature vessels, stabilized by NG2-positive perivascular cells. (f right panel) Zoomed field of IF staining showing stabilized vessels. (e) On the contrary, no vascularization was observed in the absence of OVECs. At least four images were acquired per sample. Images were analyzed using ImageJ2 (Fiji) software. Z projection was performed on maximum intensity. (g) Schematic visualization of newly formed chimeric vessels. (h) Nuclei staining (blue) showed a significantly higher cellular density in ovarian tissue transplantation supported by OVECs supplementation. Data are represented as the mean ± SEM of independent experiments (n = 5). ∗p < 0.05 (paired two-tailed t-test).
Fig. 5
Fig. 5
X-ray phase-contrast microCT examination of excised ovarian grafts. (a) Region of interest of a H&E slice showing OVECs forming perfused vessels, as they are filled with red blood cells (red dots), within the bovine scaffold matrix in the OVECs-supplemented tissue subjected to X-ray phase-contrast microCT examination. (b) X-ray phase-contrast microCT virtual slice of the paraffin-embedded OVECs-supplemented tissue. Yellow arrow points to dense structures within the bovine scaffold, representing clusters of OVECs, as confirmed by the histological image. Zoomed view of the area highlighted with higher magnification the dense structures detected within the bovine scaffold. (c) H&E slice of ovarian tissue grafted without OVECs-supplementation. (d) X-ray phase contrast microtomography virtual slice of the same sample. (e-h) X-ray phase-contrast microtomography virtual slices of the OVECs-supplemented tissue, selected at different depths within the acquired volume. Yellow arrows point out very dense structures, as a likely accumulation of OVECs. (f) High magnification visualization of the dense structures detected and highlighted by the green rectangle in (e). (h) Zoomed inset depicting the distribution of OVECs visible within the violet rectangle drawn in (g).
Fig. 6
Fig. 6
Representations of arbitrary orthogonal planes within the imaged OVECs supplemented tissue. (a) Red arrows point out healthy follicles within a well-preserved tissue. (b) Zoomed image of the two follicles.
Fig. 7
Fig. 7
Representations of the imaged OVECs supplemented tissue stained with iodine. (a) OVECs-supplemented iodine-stained tissue virtual section obtained by maximum intensity projection of selected X-ray phase-contrast microtomography slices. The human ovarian tissue is visible next to the bovine collagen scaffold. This visualization highlights the vascular system within the ovarian tissue and ECs accumulation on a preferential side (orange arrow) and EC migration from the scaffold to the tissue (yellow arrows). (b-f) Sequential sections (extracted from the sub-area displayed in the panel a with a brown dashed line) showing the gradual invasion of the OVECs at different depths within the imaged whole sample.
figs1
figs1
Schematic visualization of sample processing. The ovarian biopsy was cut in three parts: one was analyzed by immunohistochemistry, the second one was cryopreserved, and the last part was digested for cell isolation.
figs2
figs2
Scheme of ovarian blood supply. The ovary has a double blood supply: the main arterial irroration is represented by the ovarian arteries, and the second contribution is via the uterine arteries. Venous drainage is fulfilled by paired ovarian veins: the left ovarian vein drains into the left renal vein, whilst the right ovarian vein drains directly into the inferior vena cava. In the ovarian parenchyma, the progressive stages of follicular growth (a. preantral follicle; b. antral follicle; c. preovulatory follicle; d. ovulation) are represented in the upper part; in the lower part of the ovary, the formation of corpus luteum (e.) is shown.
figs3
figs3
Characterization of ovarian tissue. H&E staining of ovarian tissue showed the presence of secondary/antral follicles, besides primitive/primordial follicles. Scale bars, 50 μm.
figs4
figs4
Negative control of IHC ovary staining of secondary antibodies. Control of IHC staining showing ovarian tissue incubated with anti-rabbit Ig (a, b) or anti-mouse Ig conjugated secondary antibodies. Images are representative of 1 section out of 3 ovarian tissue samples (n = 3). AEC (red) chromogen was used to visualize the binding of secondary antibodies HRP-conjugated. Nuclei were stained with Mayer’s Hematoxylin. Magnification, 10x (a,c); 20x (b,d). Scale bars, 50 μm.
figs5
figs5
Characterization of isolated primary ovarian endothelial cells (OVECs). IF of OVECs resulted negative for the non-endothelial markers CD68, podoplanin, and CK8/18. Cells were grown to confluence in eight-chamber culture slides. After fixation and permeabilization, cells were stained with mAb anti-human CD68, podoplanin, and cytokeratin 8/18 (CK8/18), followed by anti-mouse-Alexa Fluor™ 488 or anti-rabbit-Alexa Fluor™ 488 secondary antibodies. Nuclei were stained with DAPI (blue). Original magnification, 20×.
figs6
figs6
Sample processing and evaluation. (a) Ovarian biopsies were cut into slices and vitrified for later usage. To perform in vivo experiments, slices were frozen-thawed and transplanted in the back of female NSG mice using bovine collagen as a cell-support scaffold. (b) Before grafting the tissue, immunofluorescence was performed to evaluate the presence of endogenous vessels: the ovary was stained for human CD31 (hCD31; white), and nuclei were stained with DAPI (blue) to observe the presence of vessels ab initio. (c, d left panel) IF staining of mouse CD31 (mCD31; red), human CD31 (hCD31; grey), and NG2 (green) showed that graft supplementation with OVECs resulted in the formation of mature vessels, stabilized by NG2-positive perivascular cells. (d right panel) Zoomed field of IF staining showing stabilized vessels. At least four images per sample were acquired. Images were analyzed using ImageJ2 (Fiji) software. Z projection was performed on maximum intensity.
figs7
figs7
Macroscopic evaluation of excised tissues after 14 days. The presence of OVECs resulted in a higher tissue revascularization. The first five samples were evaluated by IF analyses, the last four samples were used in QuantiGene Assay with the goal to evaluate markers of hypoxia, angiogenesis, and ovarian reserve at molecular level.
figs8
figs8
Comparison of transplanted tissues after 14 days and after 30 days. (a) Macroscopically, the presence of OVECs resulted in a higher revascularization, with no differences between the two timepoints. (b) IF staining for hCD31 (white), mCD31 (red), and NG2 (green) of excised graft with or without OVECs. The scaffol presents a characteristic autofluorescence in green channel. Results of the IF analyses showed that tissue vascularization levels dramatically decrease at 30 days compared to 14 days post-transplantation. Images were acquired with a Nikon 19506 Eclipse Ti-E inverted fluorescent microscope equipped with DC-152Q-C00-FI using NIS V4.30 software (Nikon) and a ZEISS LSM 880 with Airyscan. Merged images were acquired using NIS V4.30 software (Nikon).
figs9
figs9
Evaluation of AMH mRNA expression. The gene expression levels are reported as mRNA AMH/mRNA ACTB housekeeping gene x10-3. Data represents the results of four independent experiments.

References

    1. Ladanyi C., Mor A., Christianson M.S., Dhillon N., Segars J.H. Recent advances in the field of ovarian tissue cryopreservation and opportunities for research. J. Assist. Reprod. Genet. 2017;34:709–722. - PMC - PubMed
    1. Dolmans M.M., Donnez J., Cacciottola L. Fertility preservation: the challenge of freezing and transplanting ovarian tissue. Trends Mol. Med. 2020;27:777–791. - PubMed
    1. Cacciottola L., Donnez J., Dolmans M.M. Ovarian tissue and oocyte cryopreservation prior to iatrogenic premature ovarian insufficiency. Best Pract. Res. Clin. Obstet. Gynaecol. 2022;81:119–133. - PubMed
    1. Mishra S.R., Chung H.F., Waller M., Mishra G.D. Duration of estrogen exposure during reproductive years, age at menarche and age at menopause, and risk of cardiovascular disease events, all-cause and cardiovascular mortality: a systematic review and meta-analysis. BJOG. 2021;128:809–821. - PubMed
    1. Ataman L.M., Laronda M.M., Gowett M., Trotter K., Anvari H., Fei F., et al. A synopsis of global frontiers in fertility preservation. J. Assist. Reprod. Genet. 2022;39:1693–1712. - PMC - PubMed

LinkOut - more resources