

Accounting for contact network uncertainty in epidemic inferences with Approximate Bayesian Computation
- PMID: 40276656
- PMCID: PMC12014783
- DOI: 10.1007/s41109-025-00694-y
Accounting for contact network uncertainty in epidemic inferences with Approximate Bayesian Computation
Abstract
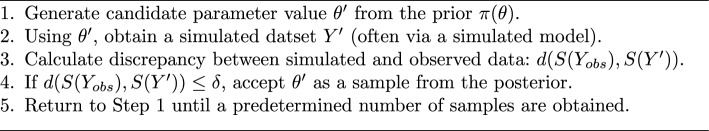
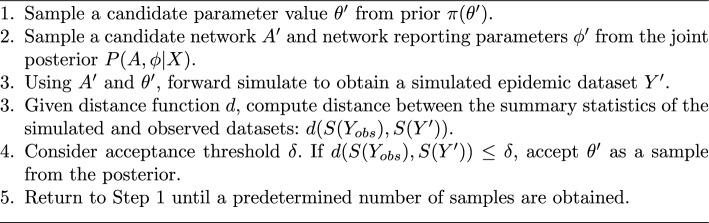
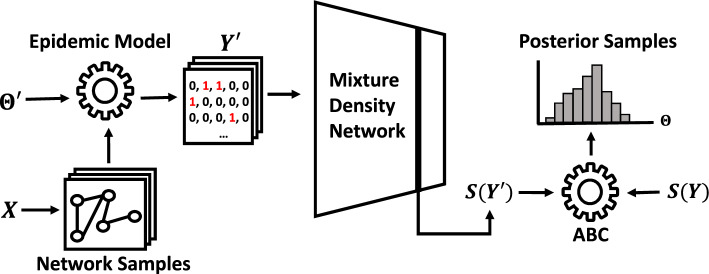
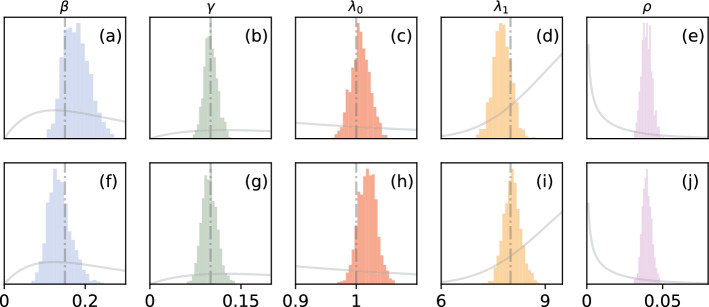
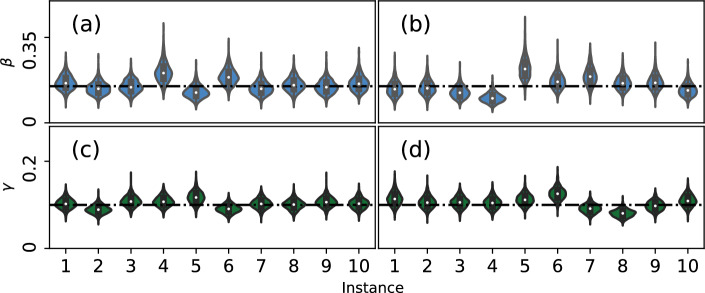
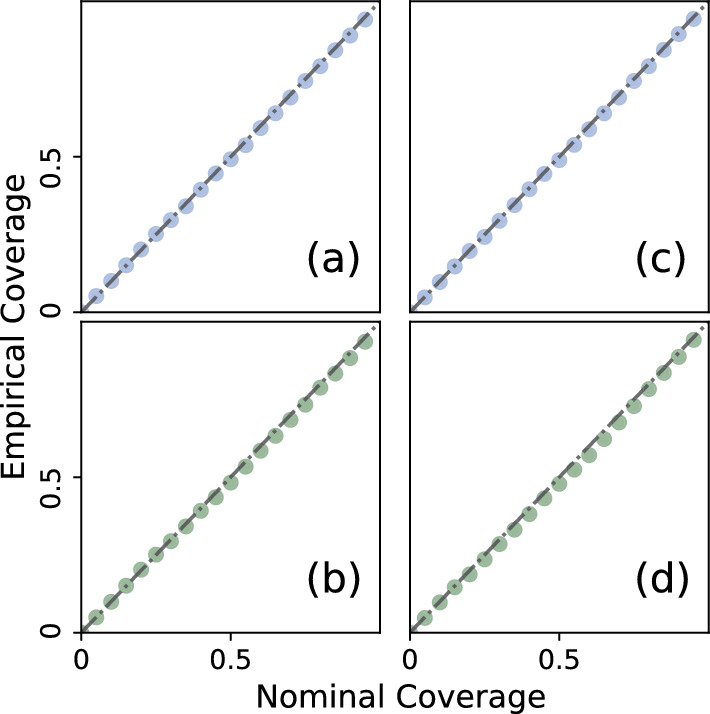
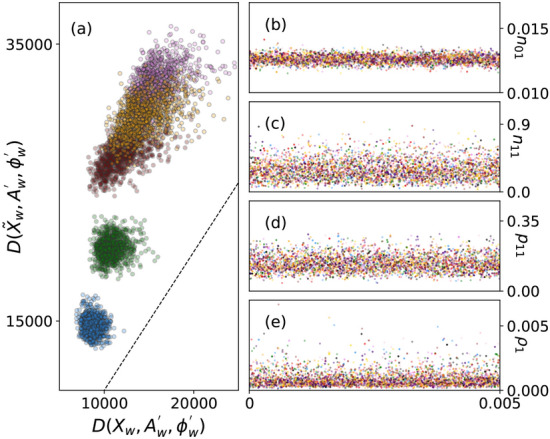
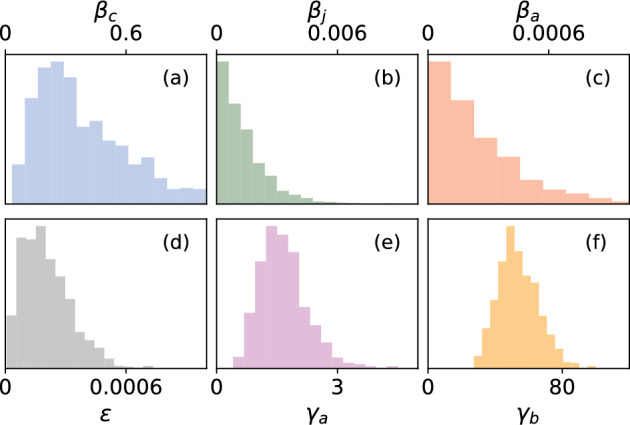
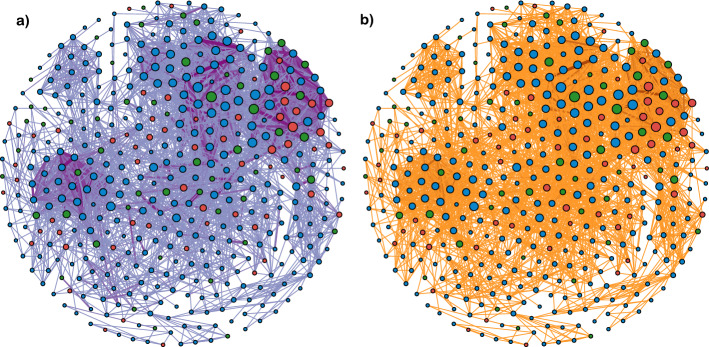
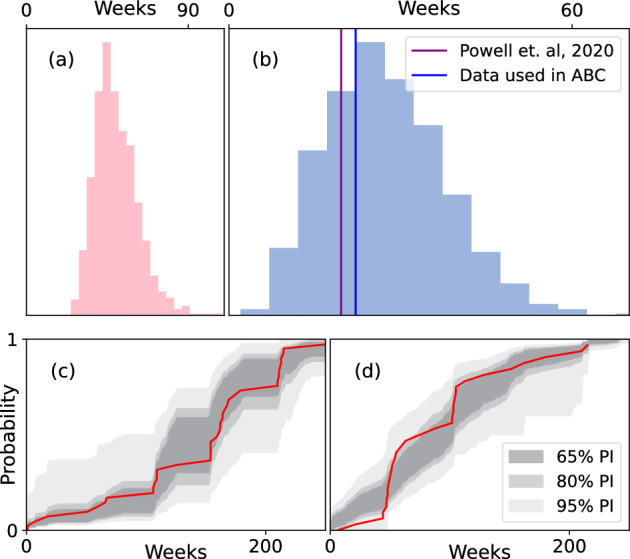
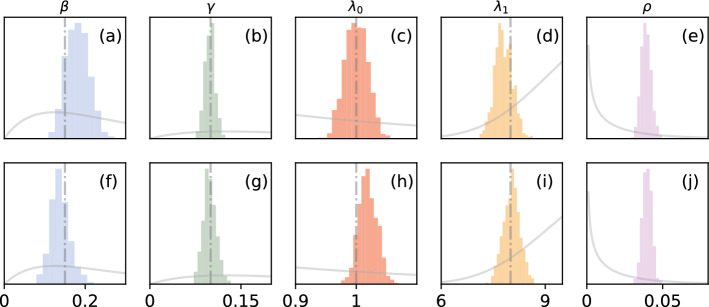
In models of infectious disease dynamics, the incorporation of contact network information allows for the capture of the non-randomness and heterogeneity of realistic contact patterns. Oftentimes, it is assumed that this underlying network is known with perfect certainty. However, in realistic settings, the observed data usually serves as an imperfect proxy of the actual contact patterns in the population. Furthermore, event times in observed epidemics are not perfectly recorded; individual infection and recovery times are often missing. In order to conduct accurate inferences on parameters of contagion spread, it is crucial to incorporate these sources of uncertainty. In this paper, we propose the use of Network-augmented Mixture Density Network-compressed ABC (NA-MDN-ABC) to learn informative summary statistics for the available data. This method will allow for Bayesian inference on the parameters of a contagious process, while accounting for imperfect observations on the epidemic and the contact network. We will demonstrate the use of this method on simulated epidemics and networks, and extend this framework to analyze the spread of Tattoo Skin Disease (TSD) among bottlenose dolphins in Shark Bay, Australia.
Keywords: Approximate Bayesian Computation; Networks; SIR model.
© The Author(s) 2025.
Conflict of interest statement
Competing interestsThe authors declare that they have no competing interests.
Figures

Update of
-
Accounting for contact network uncertainty in epidemic inferences.ArXiv [Preprint]. 2024 Apr 16:arXiv:2404.02924v2. ArXiv. 2024. Update in: Appl Netw Sci. 2025;10(1):13. doi: 10.1007/s41109-025-00694-y. PMID: 38699167 Free PMC article. Updated. Preprint.
Similar articles
-
Accounting for contact network uncertainty in epidemic inferences.ArXiv [Preprint]. 2024 Apr 16:arXiv:2404.02924v2. ArXiv. 2024. Update in: Appl Netw Sci. 2025;10(1):13. doi: 10.1007/s41109-025-00694-y. PMID: 38699167 Free PMC article. Updated. Preprint.
-
Flexible Bayesian Inference on Partially Observed Epidemics.ArXiv [Preprint]. 2023 Nov 6:arXiv:2311.04238v1. ArXiv. 2023. Update in: J Complex Netw. 2024 Mar 25;12(2):cnae017. doi: 10.1093/comnet/cnae017. PMID: 37986721 Free PMC article. Updated. Preprint.
-
Flexible Bayesian inference on partially observed epidemics.J Complex Netw. 2024 Mar 25;12(2):cnae017. doi: 10.1093/comnet/cnae017. eCollection 2024 Apr. J Complex Netw. 2024. PMID: 38533184 Free PMC article.
-
Incorporating Contact Network Uncertainty in Individual Level Models of Infectious Disease using Approximate Bayesian Computation.Int J Biostat. 2019 Dec 10;16(1). doi: 10.1515/ijb-2017-0092. Int J Biostat. 2019. PMID: 31812945
-
Approximate Bayesian inference for complex ecosystems.F1000Prime Rep. 2014 Jul 17;6:60. doi: 10.12703/P6-60. eCollection 2014. F1000Prime Rep. 2014. PMID: 25152812 Free PMC article. Review.
References
-
- Aguilar JB, Faust JS, Westafer LM, Gutierrez JB (2020) A model describing COVID-19 community transmission taking into account asymptomatic carriers and risk mitigation. MedRxiv, 2020-03
-
- Almutiry W, Deardon R (2020) Incorporating contact network uncertainty in individual level models of infectious disease using approximate Bayesian computation. Int J Biostat 16(1):20170092 - PubMed
-
- Bishop CM (1994) Mixture density networks
Grants and funding
LinkOut - more resources
Full Text Sources