. 2025 Mar 28;28(5):112308.
doi: 10.1016/j.isci.2025.112308. eCollection 2025 May 16.

Interferon-γ and IL-27 positively regulate type 1 regulatory T cell development during adaptive tolerance

Affiliations

Interferon-γ and IL-27 positively regulate type 1 regulatory T cell development during adaptive tolerance

David A J Lecky et al. iScience. .

Abstract

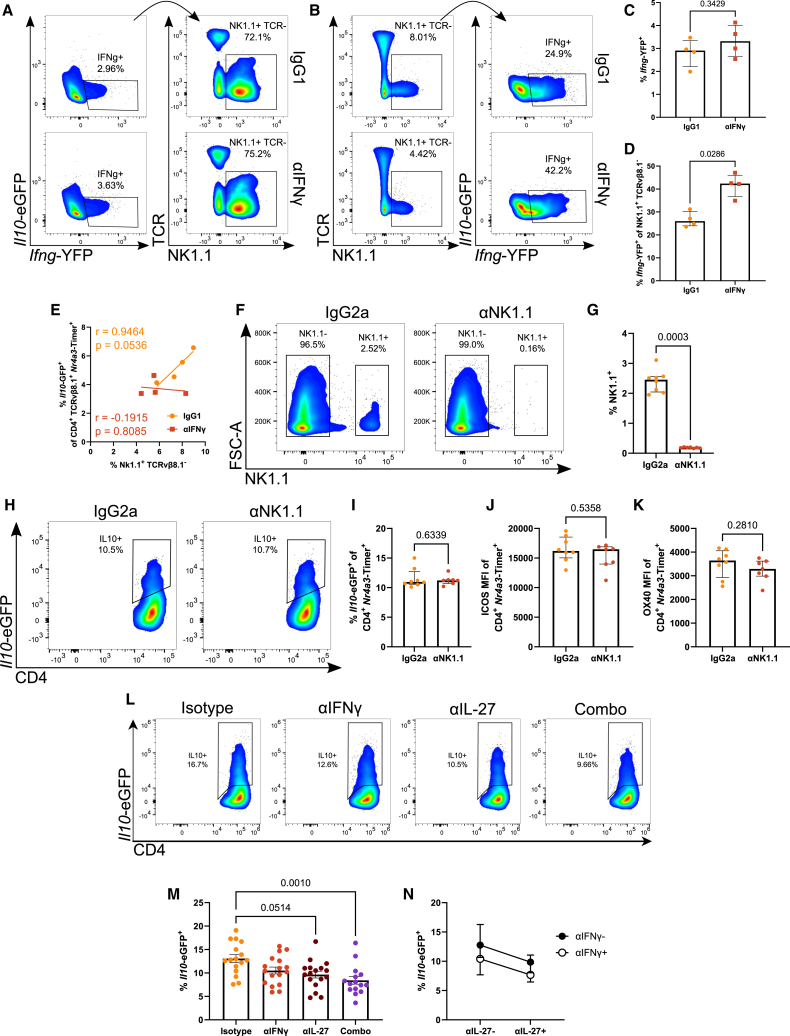
Strong T cell receptor (TCR) and interleukin (IL)-27 signaling influence type 1 regulatory (Tr1) T cell development, but whether other signals determine their differentiation is unclear. Utilizing Tg4 TCR transgenic mice, we established a model for rapid Tr1 cell induction. A single high dose of [4Y]-MBP peptide drove the differentiation of Il10 + T cells with Tr1 cell mRNA and protein signatures. Kinetic transcriptional and phenotypic analyses revealed that the Tr1 cell module was transient and preceded by Ifng transcription in other CD4+ T cells. Changes in Tr1 cell frequency correlated with altered macrophage activation, while neutralization of interferon (IFN)γ reduced Tr1 cell frequency and the TCR signal strength markers Nur77, inducible T cell costimulator (ICOS), and OX40. Antibody depletion experiments inferred that the relevant source of IFNγ was not natural killer (NK) cell derived. Additionally, blocking IL-27 in combination with IFNγ neutralization additively reduced Tr1 cell frequency in vivo. These findings reveal that IFNγ has a non-redundant role in augmenting Tr1 cell differentiation in vivo.

Keywords: Cell biology; Immunology; Stem cell research.


Conflict of interest statement

The authors declare no competing interests.

Figures

None
Graphical abstract
Figure 1
Figure 1
Kinetics of de novo Il10 transcription in response to strong tolerogenic TCR signaling Tg4 Nr4a3-Tocky Il10-EGFP mice were immunized with 0.8, 8, or 80 μg [4Y]-MBP in 200 μL PBS subcutaneously (s.c.), and spleens were harvested at 24 h. Representative flow plots (A) showing CD4+ TCRvβ8.1/8.2+ according to Nr4a3-Timer expression above and the Il10-EGFP+ of Nr4a3-Timer+ and Nr4a3-Timer below. Summary of Il10-EGFP frequency (B), LAG3 MFI (C), and TIGIT MFI (D) in Nr4a3-Timer+ (orange) or Nr4a3-Timer- (red). Summary of LAG3 (E) and TIGIT MFI (F) in Il10-EGFP+Nr4a3-Timer+. Tg4 Nr4a3-Tocky Il10-EGFP Ifng-YFP mice were administered 80 μg [4Y]-MBP in 200 μL PBS s.c., and spleens were harvested at 8, 12, or 16 h. Representative flow plots (G) showing CD4+ TCRvβ8.1/8.2+Nr4a3-Timer expression above and below Il10-EGFP against Ifng-YFP of Nr4a3-Timer+ below. Summary of Il10-EGFP+Ifng-YFP (H) and Ifng-YFP+Il10-EGFP (I) frequency, LAG3 (J), TIGIT (K), PD-1 (L), CD25 (M), CD44 (N), and CD69 (O) MFI in Nr4a3-Timer±. (B–F and H–O) bars represent mean ± SEM. Statistical analysis by two-way ANOVA with Tukey’s multiple comparisons test (B–D and H–O) or Kruskal-Wallis test with Dunn’s multiple comparisons. n = 3 per treatment or time.
Figure 2
Figure 2
Rapidly induced Il10-expressing T cells are Tr1-like cells and have a transcriptionally delayed program (A) Re-analysis of GEO: GSE165817 (Elliot et al.19) where Tg4 Nr4a3-Tocky Il10-EGFP mice were administered with 0 (control), 8, or 80 μg [4Y]-MBP in 200 μL PBS s.c. and spleens harvested at 4, 12, and 24 h for bulk RNA isolation and transcriptome analysis. Heatmap of markers associated with early T cell activation, Th1 phenotype or Tr1-like cells arising after expression of Th1 cell hallmarks. (B) Gene set enrichment analysis (GSEA) using Tr1 genes defined in Chen et al. comparing 12 h gene expression in 80 μg vs. 0.8 μg immunized mice. (C) Heatmap of rlog-normalized data for GSEA core-enrichment genes for weak (0.8 μg) versus strong (80 μg) conditions. Tg4 Nr4a3-Tocky Il10-EGFP mice were administered 4 mg/kg [4Y]-MBP in 200 μL PBS s.c., and 24 h later CD4+Il10-EGFP+ and CD4+Il10-EGFP T cells were sorted for analysis by mRNA-seq. (D) Transcriptome analysis of CD4+Nr4a3-Timer+Il10-EGFP± as a heatmap of curated Tr1 differentially expressed genes (DEGs) between conditions at 24 h. (E–G) Compared temporal expression rlog transcripts from GEO: GSE165817 (Elliot et al.19) for Ifng against Il10 (E), Ifng against Lag3 (F), and Lag3 against Il10 (G) from Tg4 Nr4a3-Timer Il10-EGFP mice administered with 80 μg [4Y]-MBP in 200 μL PBS s.c. and mRNA transcripts depicted at 4, 12, and 24 h.
Figure 3
Figure 3
Interferon-gamma positively regulates Tr1 cell differentiation Tg4 Nr4a3-Tocky Il10-EGFP Ifng-YFP mice were immunized with 4 mg/kg [4Y]-MBP in PBS s.c. and 1 mg αIFNγ or IgG1 isotype in 200 μL PBS i.p., and spleens were harvested 24 h later. Representative flow plots at 24 h (A) showing CD4+ TCRvβ8.1/8.2+ according to Nr4a3-Timer expression above and the Il10-EGFP against Ifng-YFP of Nr4a3-Timer+ below. Summary of Il10-EGFP (B) and Ifng-YFP (C) frequency in Nr4a3-Timer+ and CD69 (D), TIGIT (E), LAG3 (F), ICOS (G), and GITR (H) MFI. Tg4 Nr4a3-Tocky Il10-EGFP Ifng-YFP mice were immunized with 4 mg/kg [4Y]-MBP in PBS s.c. and 1 mg αIFNγ or IgG1 isotype in 200 μL PBS i.p., and spleens were harvested at 12 h (I) showing CD11b against MHC Class II to the left, and from CD11b+, F4/80 against MHC Class II to the right. Summary of F4/80+ MHCII+ (“Inflammatory” myeloid) frequency (J) CD40 (K), PD-L1 (L), CD86 (M), and MHC Class II (N) MFI. Linear regression (Pearson’s correlation p value and r value in red) of CD4+Nr4a3-Timer+Il10-EGFP+ frequency against CD40 (O), CD86 (P), MHC Class II (Q), and PD-L1 (R) MFI in the inflammatory myeloid compartment. (B–H and I–N) Bars represent median with interquartile range. Statistical analysis by Mann-Whitney U test. n = 8 (A–I) and n = 7 (J–R) per treatment.
Figure 4
Figure 4
Anti-IFNγ treatment reduces TCR signal strength in vivo Tg4 Nur77-Tempo Il10-EGFP mice received 1 mg αIFNγ or IgG1 isotype in 200 μL PBS i.p before immunization with 4 mg/kg [4Y]-MBP in PBS s.c., and spleens were harvested at 24 h. (A and B) (A) Nur77-Blue versus Nur77-Red or (B) Il10-EGFP vs. CD4 in CD4+ T cells at 24 h. (C–I) (C) Summary of % Nur77-Blue+Red+, (D) Nur77-Blue MFI in the two treatment, or % Il10-EGFP (E) in CD4+ T cells. ICOS (F) or OX40 (G) MFI in CD4+ T cells. Correlation of Nur77-Blue MFI versus ICOS MFI (H) or OX40 MFI (I) in CD4+ T cells using linear regression (Pearson’s correlation p value and r2 values are shown). Isotype (n = 7), αIFNγ (n = 8). Bars represent median+/−interquartile range (IQR). Statistical analysis by Mann-Whitney U test.
Figure 5
Figure 5
IFNγ and IL-27 additively regulate Tr1 cell development Tg4 Nr4a3-Tocky Il10-EGFP Ifng-YFP mice were administered 4 mg/kg [4Y]-MBP in PBS s.c. and 1 mg αIFNγ or IgG1 isotype in 200 μL PBS i.p., and spleens were harvested at 24 h. Representative flow plots showing Il10-EGFP against Ifng-YFP above and Ifng-YFP+-derived TCRvβ8.1/8.2 against NK1.1 below (A) and TCRvβ8.1/8.2 against NK1.1 above and NK1.1+-derived Il10-EGFP against Ifng-YFP below (B). Summary of Ifng-YFP+ frequency (C) from (A) and Ifng-YFP+ frequency from NK1.1+ (D) from (B). Linear regression (Pearson’s correlation) of CD4+Nr4a3-Timer+Il10-EGFP+ against NK1.1+ TCRvβ8.1/8.2 (E). Tg4 Nr4a3-Tocky Il10-EGFP mice were given 200 μg αNK1.1 or IgG2a isotype in 200 μL PBS i.p. and 48 h later were immunized with 4 mg/kg [4Y]-MBP in PBS s.c., and spleens were harvested 24 h later. Representative spectral cytometry plots showing NK1.1 against FSC-A (F). Summary of NK1.1+ (G) from (F). Representative spectral cytometry plots at 24 h showing Il10-EGFP against CD4 (H). Summary of Il10-EGFP+ frequency (I) and ICOS (J) and OX40 (K) MFI of CD4+Nr4a3-Timer+ T cells. Tg4 Nr4a3-Tocky Il10-EGFP mice were administered 4 mg/kg [4Y]-MBP in PBS s.c. and 0.5 mg αIFNγ, αIL-27, a combination of both, or a mixed IgG1 and IgG2a isotype in 200 μL PBS i.p., and spleens were harvested 24 h later. Representative spectral cytometry plots at 24 h showing Il10-EGFP against CD4 in Nr4a3-Timer+ (L). Summary of Il10-EGFP+ frequency within the CD4+Nr4a3-Timer+ T cells. (M) Analysis for additive effect of treatment by factoring αIFNγ and αIL-27 as two variables (N).(C, D, G, I–K, M, and N) Bars represent median with interquartile range. Statistical analysis by Mann-Whitney U test (C, D, and I–K), Kruskal-Wallis test with Dunn’s multiple comparisons (M). n = 4 (A–E), n = 8 (F–K), n = 15 (Combo), n = 16 (isotype), n = 17 (αIFNγ), and n = 17 (αIL-27) (L–N) per treatment.

References

    1. Ng T.H.S., Britton G.J., Hill E.V., Verhagen J., Burton B.R., Wraith D.C. Regulation of adaptive immunity; the role of interleukin-10. Front. Immunol. 2013;4:129. doi: 10.3389/fimmu.2013.00129. - DOI - PMC - PubMed
    1. Koppelman B., Neefjes J.J., De Vries J.E., De Waal Malefyt R. Interleukin-10 down-regulates MHC class II αβ peptide complexes at the plasma membrane of monocytes by affecting arrival and recycling. Immunity. 1997;7:861–871. doi: 10.1016/S1074-7613(00)80404-5. - DOI - PubMed
    1. D’andrea A., Aste-Amezaga M., Valiante N.M., Ma X., Kubin M., Trinchieri G. Interleukin 10 (IL-10) Inhibits human lymphocyte interferon γ-production by suppressing natural killer cell stimulatory factor/IL-12 synthesis in accessory cells. J. Exp. Med. 1993;178:1041–1048. doi: 10.1084/jem.178.3.1041. - DOI - PMC - PubMed
    1. Ito S., Ansari P., Sakatsume M., Dickensheets H., Vazquez N., Donnelly R.P., Larner A.C., Finbloom D.S. Interleukin-10 inhibits expression of both interferon α- and interferon γ-induced genes by suppressing tyrosine phosphorylation of STAT1. Blood. 1999;93:1456–1463. doi: 10.1182/blood.v93.5.1456.404a34_1456_1463. - DOI - PubMed
    1. Yamaoka K., Otsuka T., Niiro H., Nakashima H., Tanaka Y., Nagano S., Ogami E., Niho Y., Hamasaki N., Izuhara K. Selective DNA-binding activity of interleukin-10-stimulated STAT molecules in human monocytes. J. Interferon Cytokine Res. 1999;19:679–685. doi: 10.1089/107999099313839. - DOI - PubMed

LinkOut - more resources