. 2025 Apr;44(8-9):e70075.
doi: 10.1002/sim.70075.

Evaluation of Rolling Surveillance Methods in Context of Prior Aberrations: A Simulation Study With Routine Data From Low- and Middle-Income Countries

Affiliations

Evaluation of Rolling Surveillance Methods in Context of Prior Aberrations: A Simulation Study With Routine Data From Low- and Middle-Income Countries

Anuraag Gopaluni et al. Stat Med. 2025 Apr.

Abstract

Syndromic surveillance integrated into routine health management information systems could improve timely detection of disease outbreaks, particularly in low- and middle-income countries that have limited diagnostic data. This study evaluates the impact of prior anomalies referred to as "aberrations," such as historical outbreaks, that can distort "baseline data" on the accuracy of rolling surveillance methods that track ongoing disease trends. We assessed five widely used outbreak detection algorithms-EARS, Farrington, Holt-Winters, and two versions of the Weinberger-Fulcher model (negative binomial (WF NB) and quasipoisson (WF QP))-under simulation scenarios motivated by 5 years of acute respiratory infection data from Liberia. We evaluated seven data-generating mechanisms that cover a wide range of temporal and seasonal patterns. We assessed the accuracy of the outbreak detection algorithms under varied size and timing of outbreaks and aberrations. Accuracy was measured through sensitivity and specificity, with a joint assessment of both metrics using pseudo-ROC curves. Results showed that the introduction of aberrations reduced sensitivity in general, but the algorithms' relative performances were highly context-dependent. EARS and WF models demonstrated high sensitivity for detecting outbreaks when no recent aberrations were present. However, when aberrations occurred within the last year of baseline data, Holt-Winters-unless there was evidence of strong time trends-and WF QP maintained better overall balance between sensitivity and specificity. The Farrington algorithm exhibited strong sensitivity with recent aberrations but at the cost of lower specificity. These findings provide actionable insights and practical recommendations for implementing rolling surveillance in resource-constrained environments, emphasizing the need to consider historical data disturbances and rigorously evaluate sensitivity and specificity jointly.

Keywords: aberrations; health management information systems; low‐ and middle‐income countries; outbreak detection; rolling surveillance; sensitivity and specificity.


Conflict of interest statement

Conflicts of Interest

The authors declare no conflicts of interest.

Figures

FIGURE 1 |
FIGURE 1 |
Process for syndromic surveillance with data for acute respiratory infections (ARIs) for a facility in Liberia. Step 1 (a): Graph raw data from the facility; divide data into the baseline and evaluation period. Step 2 (b): Use baseline data to model expected counts and 95% prediction intervals in the baseline. Step 3 (c): Compare observed and expected values during the evaluation period to identify significant deviations.
FIGURE 2 |
FIGURE 2 |
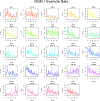
Example data and mean fit for DGM 1.
FIGURE 3 |
FIGURE 3 |
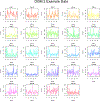
Example data and mean fit for DGM 2.
FIGURE 4
FIGURE 4
Simulation flowchart.
FIGURE 5 |
FIGURE 5 |
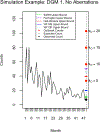
Simulation and evaluation metrics example under DGM 1 and no aberrations.
FIGURE 6 |
FIGURE 6 |
For DGM 1, outbreak of size kO=10, and aberrations anytime of length l=4 and size kA=10: The effect of the outbreak month on the median sensitivity and specificity across the 24 sets of baseline data generating coefficients.
FIGURE 7 |
FIGURE 7 |
For DGM 1 and outbreak sizes of kO=5,10,20: The boxplots of sensitivities and specificities across 24 sets of baseline data generating coefficients under (a) no aberrations (left), (b) aberrations of size kA=10 and length l=4 anytime during the baseline period (center), and (c) aberrations of size kA=10 and length l=4 within the last year (right).
FIGURE 8 |
FIGURE 8 |
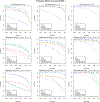
For DGM 1, Pseudo-ROC curves under different outbreak sizes: (a) kO=5 (left column), (b) kO=10 (center column), and (c) kO=20 (right column); and different aberration scenarios: (a) no aberrations (top row), (b) aberrations of size kA=10 and length l=4 anytime during the baseline period (center row), and (c) aberrations of size kA=10 and length l=4 within the last year (bottom row).
FIGURE 9 |
FIGURE 9 |
For DGM 2 and outbreak sizes of kO=5,10,20: The boxplots of sensitivities and specificities across 24 sets of baseline data generating coefficients under (a) no aberrations (left), (b) aberrations of size kA=10 and length l=4 anytime during the baseline period (center), and (c) aberrations of size kA=10 and length l=4 within the last year (right).
FIGURE 10 |
FIGURE 10 |
For DGM 2, Pseudo-ROC curves under different outbreak sizes: (a) kO=5 (left column), (b) kO=10 (center column), and (c) kO=20 (right column); and different aberration scenarios: (a) no aberrations (top row), (b) aberrations of size kA=10 and length l=4 anytime during the baseline period (center row), and (c) aberrations of size kA=10 and length l=4 within the last year (bottom row).
FIGURE 11 |
FIGURE 11 |
For DGM 1 with normalized counts and outbreak sizes of kO=5,10,20: The boxplots of sensitivities and specificities across 24 sets of baseline data generating coefficients under (a) no aberrations (left), (b) aberrations of size kA=10 and length l=4 anytime during the baseline period (center), and (c) aberrations of size kA=10 and length l=4 within the last year (right).
FIGURE 12
FIGURE 12
For DGM 2 with normalized counts and outbreak sizes of kO=5,10,20: The boxplots of sensitivities and specificities across 24 sets of baseline data generating coefficients under (a) no aberrations (left), (b) aberrations of size kA=10 and length l=4 anytime during the baseline period (center), and (c) aberrations of size kA=10 and length l=4 within the last year (right).

References

    1. Buehler JW, Hopkins RS, Overhage JM, Sosin DM, Tong V, and CDC Working Group, “Framework for Evaluating Public Health Surveillance Systems for Early Detection of Outbreaks: Recommendations From the CDC Working Group,” MMWR - Recommendations and Reports 53, no. RR-5 (2004): 1–11. - PubMed
    1. Wagner MM, Tsui FC, Espino JU, et al. , “The Emerging Science of Very Early Detection of Disease Outbreaks,” Journal of Public Health Management and Practice 7, no. 6 (2001): 51–59. - PubMed
    1. Fienberg SE and Shmueli G, “Statistical Issues and Challenges Associated With Rapid Detection of Bio-Terrorist Attacks,” Statistics in Medicine 24, no. 4 (2005): 513–529. - PubMed
    1. Buckeridge DL, “Outbreak Detection Through Automated Surveillance: A Review of the Determinants of Detection,” Journal of Biomedical Informatics 40, no. 4 (2007): 370–379. - PubMed
    1. Lal A, Ashworth HC, Dada S, Hoemeke L, and Tambo E, “Optimizing Pandemic Preparedness and Response Through Health Information Systems: Lessons Learned From Ebola to COVID-19,” Disaster Medicine and Public Health Preparedness 16, no. 1 (2022): 333–340. - PMC - PubMed

MeSH terms