. 2025 May 21;91(5):e0147024.
doi: 10.1128/aem.01470-24. Epub 2025 Apr 25.

CrAssphage distribution analysis in an Amazonian river based on metagenomic sequencing data and georeferencing

Affiliations

CrAssphage distribution analysis in an Amazonian river based on metagenomic sequencing data and georeferencing

David Tavares Martins et al. Appl Environ Microbiol. .

Abstract

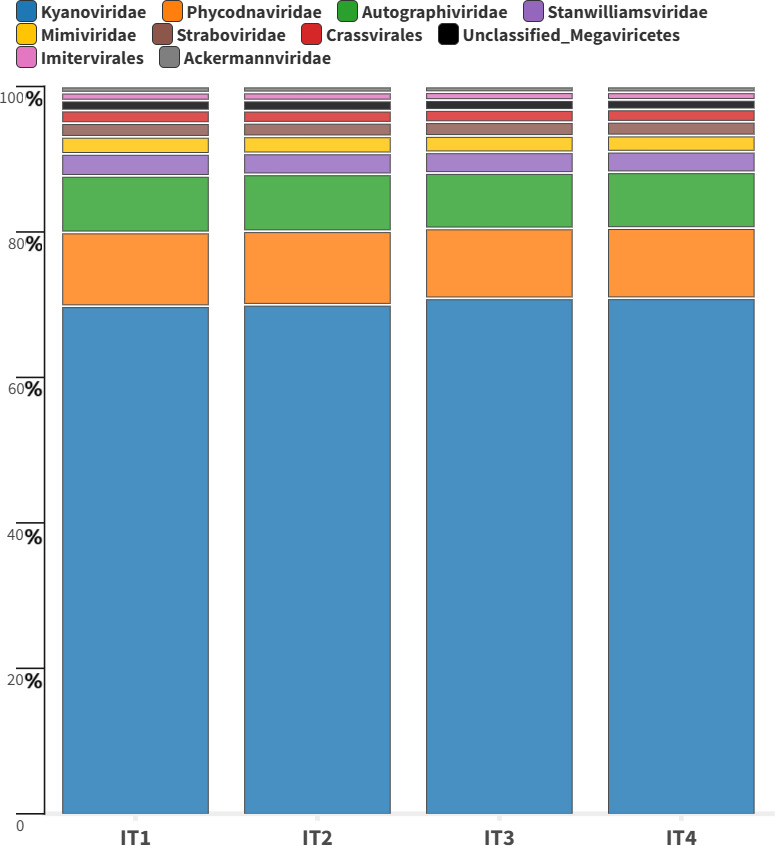
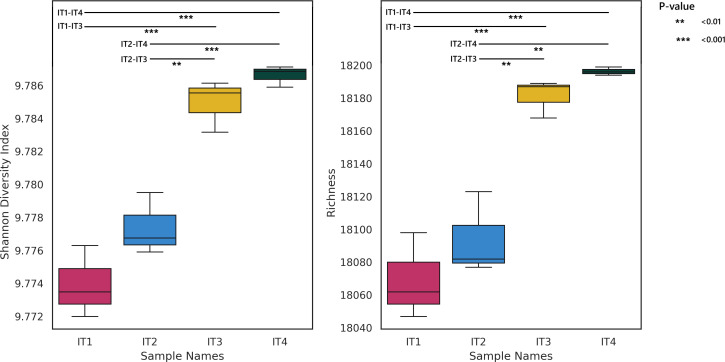
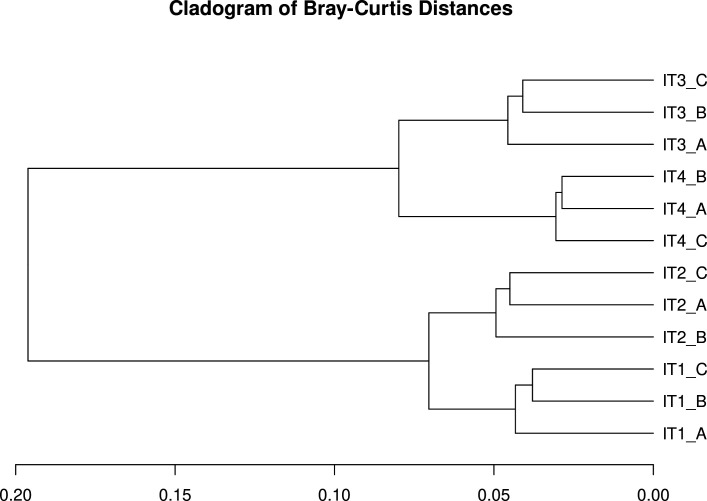
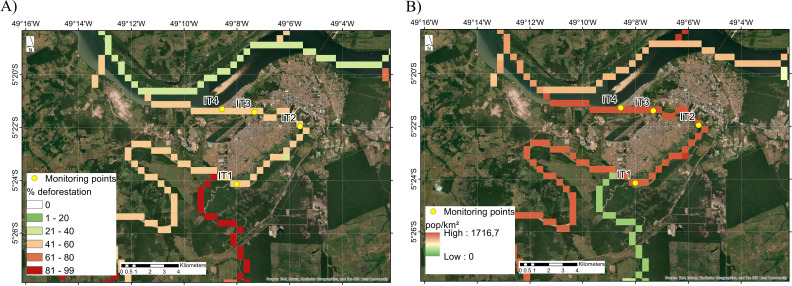
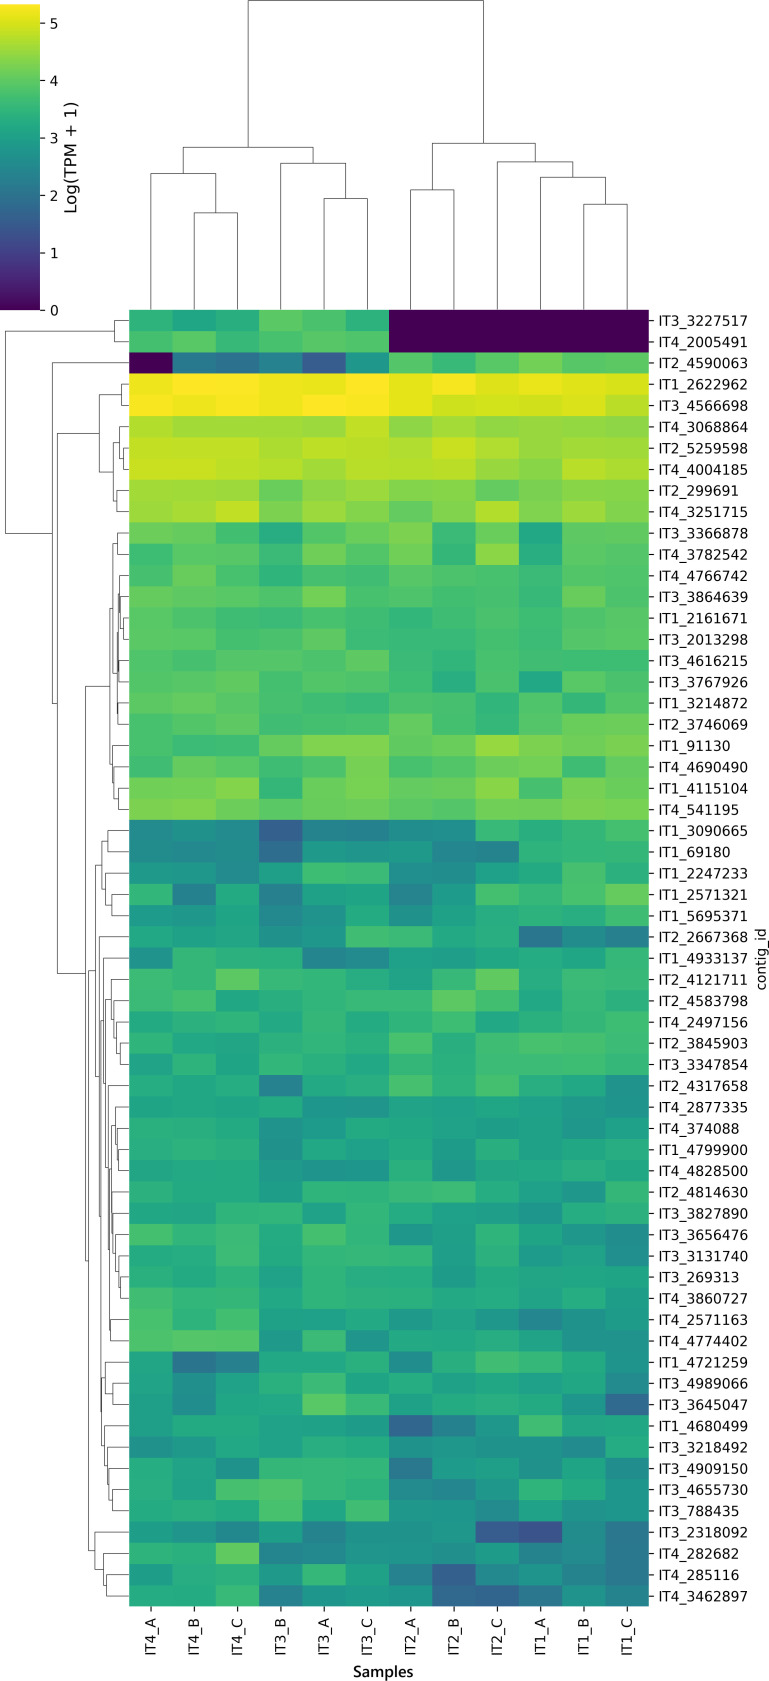
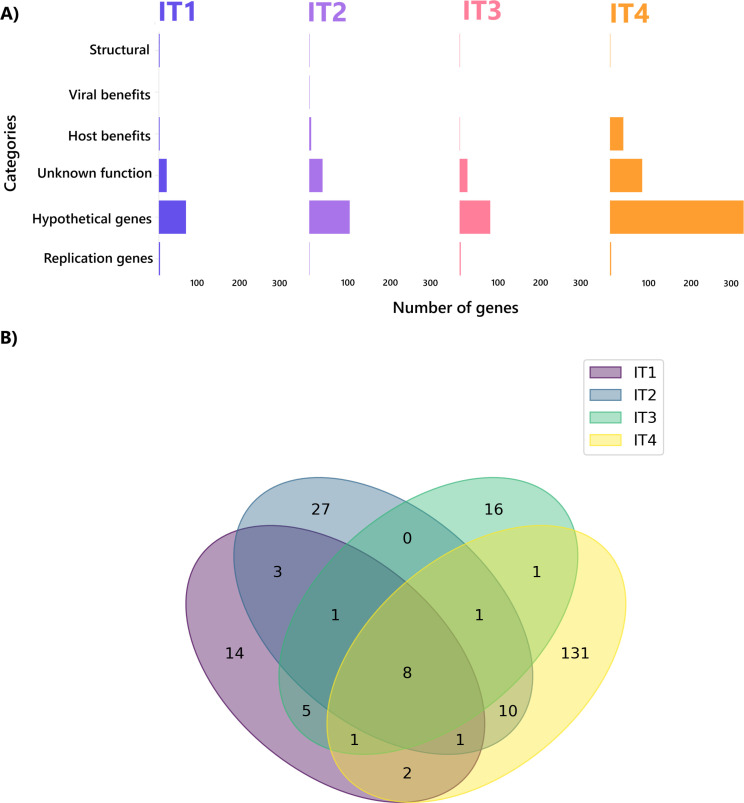
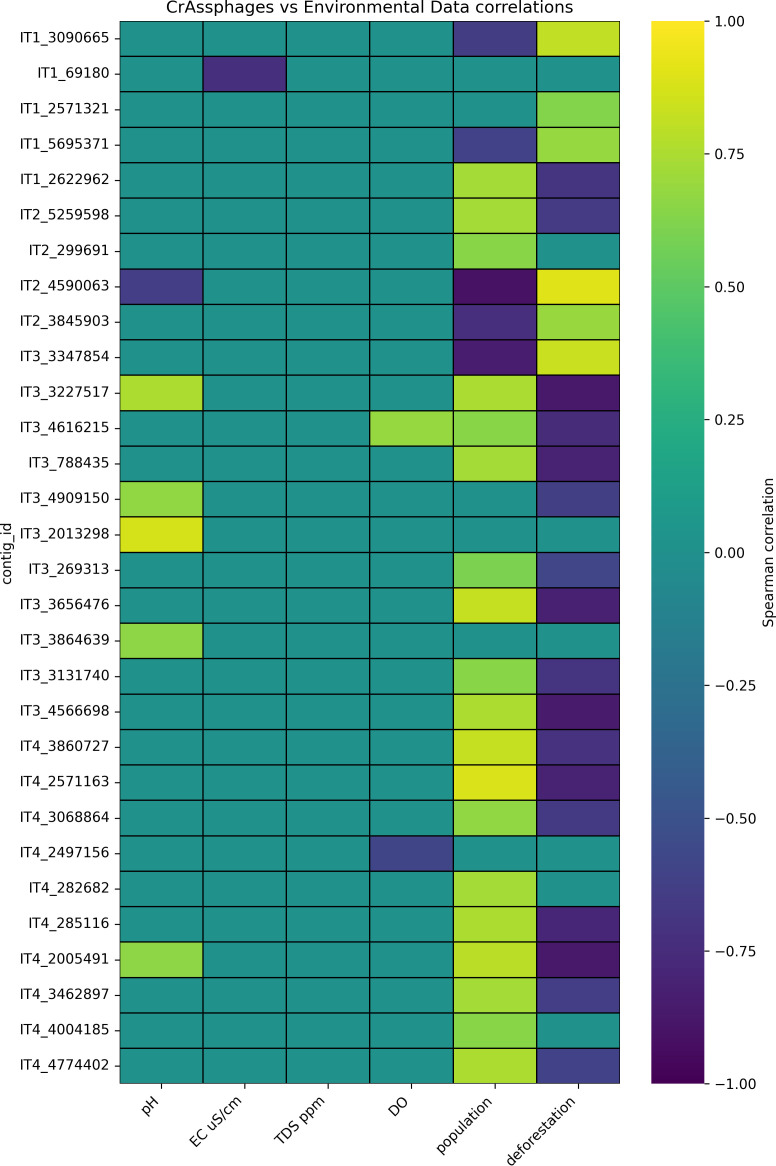
Viruses are the most abundant biological entities in all ecosystems of the world. Their ubiquity makes them suitable candidates for indicating fecal contamination in rivers. Recently, a group of Bacteroidetes bacteriophages named CrAssphages, which are highly abundant, sensitive, and specific to human feces, were studied as potential viral biomarkers for human fecal pollution in water bodies. In this study, we evaluated the presence, diversity, and abundance of viruses with a focus on crAssphages via metagenomic analysis in an Amazonian river and conducted correlation analyses on the basis of physicochemical and georeferencing data. Several significant differences in viral alpha diversity indexes were observed among the sample points, suggesting an accumulation of viral organisms in the river mouth, whereas beta diversity analysis revealed a significant divergence between replicates of the most downstream point (IT4) when compared to the rest of the samples, possibly due to increased human impact at this point. In terms of the presence of crAssphage, the analysis identified 61 crAssphage contigs distributed along the Itacaiúnas River. Moreover, our analysis revealed significant correlations between 19 crAssphage contigs and human population density, substantiating the use of these viruses as possible markers for human fecal pollution in the Itacaiúnas River. This study is the first to assess the presence of crAssphages in an Amazonian river, with results suggesting the potential use of these viruses as markers for human fecal pollution in the Amazon.

Importance: The Amazon biome is one of the most diverse ecosystems in the world and contains the most vast river network; however, the continuous advance of urban centers toward aquatic bodies exacerbates the discharge of pollutants into these water bodies. Fecal contamination contributes significantly to water pollution, and the application of an improved fecal indicator is essential for evaluating water quality. In this study, we evaluated the presence, diversity, and abundance of crAssphages in an Amazonian river and performed correlation analysis on the basis of physicochemical and georeferencing data to test whether crAssphages are viable fecal pollution markers. Our analysis revealed both the presence of crAssphages and their correlation with physicochemical data and showed significant correlations between the relative abundance of crAssphages and human density. These results suggest the potential use of these viruses as markers for water quality assessment in Amazonian rivers.

Keywords: Amazon; CrAssphage; biomarker; fecal contamination; freshwater.


Conflict of interest statement

The authors declare no conflict of interest.

Figures

Fig 1
Fig 1
Viral contigs classified by geNomad. Phages classified in the Crassvirales order are represented in red.
Fig 2
Fig 2
Shannon index and richness of the viral population across the Itacaiúnas River classified on the basis of the relative abundances of viral contigs as identified by geNomad along with P values of post hoc Bonferroni tests. In the y-axis scales, significant differences between the viral diversity of the sample points are highlighted.
Fig 3
Fig 3
Viral beta diversity represented with Bray‒Curtis distances in a dendrogram. The samples are labeled according to collection site.
Fig 4
Fig 4
(A) Percentage of deforestation in areas adjacent to the sampling points. The intensity is represented by color, with red representing high, yellow indicating medium, and green showing low levels of deforestation. (B) Population density by km2 in areas adjacent to the sampling points. The intensities of the values are represented by the same colors used in panel A. The maps were generated by using ArcMap 10.8 together with a Fortran in-house script.
Fig 5
Fig 5
The relative abundances of crAssphage contigs as identified by geNomad. The relative abundances were calculated by mapping reads to the contigs that were normalized via TPM and transformed to log10(TPM + 1). The x-axis labels represent the sample names, while the y-axis labels represent the contig names.
Fig 6
Fig 6
(A) CrAssphage gene categories at the four sampling points. The genes are divided into six different categories. Viral structural genes: genes responsible for the physical structure of viruses; viral genes with viral benefits: genes that encode proteins that increase the virus’s ability to infect, replicate, and disseminate throughout the host; viral genes with host benefits: genes that can modulate host cellular processes in a way that benefits the host; viral genes with unknown function: genes with unknown functions but with experimentally validated existence; viral genes with hypothetical functions: genes that are predicted in silico but are not experimentally validated; viral replication genes: genes that encode proteins that are directly involved in the replication of the viral genome. (B) Distribution of unique crAssphage genes along the sample points.
Fig 7
Fig 7
Correlations of crAssphage contig relative abundance with environmental parameters. The purple values indicate negative correlations, whereas the yellow values indicate positive correlations. The x-axis labels represent the sample names while the y-axis labels represent the contig names.

Similar articles

References

    1. Ellwanger JH, Kulmann-Leal B, Kaminski VL, Valverde-Villegas JM, Veiga A, Spilki FR, Fearnside PM, Caesar L, Giatti LL, Wallau GL, Almeida SEM, Borba MR, Hora VPD, Chies JAB. 2020. Beyond diversity loss and climate change: impacts of Amazon deforestation on infectious diseases and public health. An Acad Bras Cienc 92:e20191375. doi:10.1590/0001-3765202020191375 - DOI - PubMed
    1. Latrubesse EM, Arima EY, Dunne T, Park E, Baker VR, d’Horta FM, Wight C, Wittmann F, Zuanon J, Baker PA, Ribas CC, Norgaard RB, Filizola N, Ansar A, Flyvbjerg B, Stevaux JC. 2017. Damming the rivers of the Amazon basin. Nature 546:363–369. doi:10.1038/nature22333 - DOI - PubMed
    1. Guerrero-Latorre L, Romero B, Bonifaz E, Timoneda N, Rusiñol M, Girones R, Rios-Touma B. 2018. Quito’s virome: metagenomic analysis of viral diversity in urban streams of Ecuador’s capital city. Sci Total Environ 645:1334–1343. doi:10.1016/j.scitotenv.2018.07.213 - DOI - PubMed
    1. Nogueira WG, Gois BVA, Pinheiro K da C, Aragão A de O, Queiroz ALC, da Silva AL, Folador AC, Ramos RTJ. 2022. Viral metagenomics reveals widely diverse viral community of freshwater Amazonian lake. Front Public Health 10:869886. doi:10.3389/fpubh.2022.869886 - DOI - PMC - PubMed
    1. Reddy S, Kaur K, Barathe P, Shriram V, Govarthanan M, Kumar V. 2022. Antimicrobial resistance in urban river ecosystems. Microbiol Res 263:127135. doi:10.1016/j.micres.2022.127135 - DOI - PubMed

LinkOut - more resources