. 2025 Dec;30(1):2495367.
doi: 10.1080/13510002.2025.2495367. Epub 2025 Apr 25.

Dietary supplementation of male mice with inorganic, organic or nanoparticle selenium preparations: evidence supporting a putative gut-thyroid-male fertility axis

Affiliations

Dietary supplementation of male mice with inorganic, organic or nanoparticle selenium preparations: evidence supporting a putative gut-thyroid-male fertility axis

A Mojadadi et al. Redox Rep. 2025 Dec.

Abstract

Selenium (Se) is linked to physiological homeostasis. Male mice (n = 8/group) were fed control (AIN93G) or diets enriched in sodium selenite (NaSe, 5.6 ppm), methylselenocysteine (Met, 4.7 ppm), diphenyl diselenide (DPDS, 14.2 ppm), or nanoselenium (NanoSe, 2.7 ppm); dietary Se ascertained by inductively-coupled plasma mass spectrometry. At 4 weeks testes, sperm, thyroids, blood and stool were collected to assess histoarchitecture, circulating hormones (thyroxine, T4; triiodothyronine, T3; thyroid stimulating hormone, TSH) and gut microbiome (16S rRNAV3-V4 amplicon sequencing). Supplemented NaSe, Met, and NanoSe increased plasma testosterone and testis glutathione peroxidases (GPx-1/4) while testicular superoxide dismutase and catalase increased slightly in the NanoSe group indicating a selective antioxidant response. Overall, NanoSe and NaSe enhanced male reproductive factors. All thyroids isolated from Se-supplemented mice contained marginal vacuoles and a lower follicle area vs control. Nano-Se enhanced thyroidiodothyronine deiodinase-1 (DIO1) expression however, thyroid GPx-1/4 remained unchanged. Supplemented NaSe and DPDSl increased plasma T3/T4 ratio, while plasma TSH was unchanged. Microbiome analyses showed that NanoSe was most efficacious in altering composition (judged by α-diversity, Shannon index and taxon richness) while the NaSe diet showed the greatest overall change in α-diversity. Dietary Se supplementation, particularly encapsulated NanoSe, may improve male fertility factors by enhancing the gut-thyroid-fertility axis.

Keywords: Dietary selenium; male fertility; microbiome; microbiota; nanoselenium; testosterone; thyroid; thyroid hormone.


Conflict of interest statement

No potential conflict of interest was reported by the author(s).

Figures

Figure 1.
Figure 1.
Flow chart illustrating the experimental design and timeline for monitoring mice, organ collection and analysis. All mice were at 8 weeks of age at the time of onset of the experiment. Mice were randomly assigned to the various dietary treatment groups (to give a total of n = 8 animals/ group). All groups were monitored for physical and behavioural parameters over the 4 weeks of dietary intervention until organ collection for biochemical and histological analyses.
Figure 2.
Figure 2.
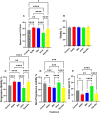
Average body and testicular weights, and Gonadosomatic index in male C57BL/6 receiving dietary Se. Male fertility parameters were analysed and assessed for statistical differences using GraphPad Prism. Data represent the mean ± SEM of (a) Average body weight per treatment group expressed in units (g), (b) Average testicular weight expressed in units (g) and the corresponding mean ratio of testicular vs body weight (c) Gonadosomatic index (GSI). Treatment groups are defined as mice supplemented control, sodium selenite (NaSe), Se-methyl-selenocysteine (Met), diphenyl diselenide (DPDS), and nano selenium (NanoSe) diets (n = 8/group). Group effects were determined by one-way analysis of variance (ANOVA) to establish statistical significance (*p ≤ 0.05, **p ≤ 0.01, ***p ≤ 0.001, ****p ≤ 0.0001) since all data sets satisfied normalcy criteria.
Figure 3.
Figure 3.
Evaluation of male fertility parameters in male C57BL/6 mice receiving dietary Se. Data represent the mean ± SEM of the following parameters (a) sperm count in (10^6 /mL), (b) vitality in (%), (c) progressive motility in (%), (d) non-progressive motility in (%) and (e) immotile in (%). Treatment groups are control (vehicle-treated diet), or chow enriched with sodium selenite (NaSe), Se-methyl-selenocysteine (Met), diphenyl diselenide (DPDS), and nano selenium (NanoSe) (n = 8/group). Between group effects were determined by one-way analysis of variance (ANOVA) to establish statistical significance (*p ≤ 0.05, **p ≤ 0.01, ***p ≤ 0.001, ****p ≤ 0.0001); all data sets satisfied normalcy criteria.
Figure 4.
Figure 4.
Concentration of plasma testosterone levels in male C57BL/6 receiving dietary Se. The gathered data were collected for analysing statistical differences using GraphPad Prism. Data represent the mean ± SEM of testosterone concentration in plasma (pg/mL). Treatment groups are control, sodium selenite (NaSe), Se-methyl-selenocysteine (Met), diphenyl diselenide (DPDS), and nano selenium (NanoSe) (n = 8/group). Group effects were determined by one-way analysis of variance (ANOVA) to establish statistical significance (*p ≤ 0.05, **p ≤ 0.01, ***p ≤ 0.001, ****p ≤ 0.0001). Since all data sets satisfied normalcy criteria.
Figure 5.
Figure 5.
Testicular histology of C57BL/6 Male Mouse receiving dietary Se. (A1) Testis section from control group 10x magnification, (A2) 20x magnification, (A3) 40x magnification, (B1) Testis section from NaSe group 10x magnification, (B2) 20x magnification, (B3) 40x magnification, (C1) Testis section from Met group 10x magnification, (C2) 20x magnification, (C3) 40x magnification, (D1) Testis section from DPDS group 10x magnification, (D2) 20x magnification, (D3) 40x magnification, (E1) Testis section from NanoSe group 10x magnification, (E2) 20x magnification, (E3) 40x magnification. No histoarchitectural differences were determined between the different selenium fortified groups and control. Scale bars shown represent 100 μm (10x), 50 μm (20x) and 20 μm (40x). Black arrow shows a normal seminiferous tubules and conservative seminiferous epithelium in all groups (10x); Image B2 (20x;) shows representative histology for all groups of spermatogenic cells (black curved dashed arrows); Green arrow identifies ‘Sertoli cell’.
Figure 6.
Figure 6.
Identification of glutathione peroxidase 1 using immunohistochemistry (GPX1) in testes from male C57BL/6 receiving dietary Se. A positive signal is shown by a black arrow (brown staining), (Bar = 10 µm). Treatment groups are (a) control, (b) sodium selenite (NaSe), (c) Se-methyl-selenocysteine (Met), (d) diphenyl diselenide (DPDS), and (e) nano selenium (NanoSe) (n = 8/group). The levels of protein expression (f) as measured by using an automated in-silico method with ImageJ (for details see Supplemental Figure S4).
Figure 7.
Figure 7.
Identification of glutathione peroxidase 4 using immunohistochemistry (GPX4) in testes from male C57BL/6 receiving dietary Se. A positive signal is shown by a black arrow (brown staining), (Bar = 10 µm). Treatment groups are (a) control, (b) sodium selenite (NaSe), (c) Se-methyl-selenocysteine (Met), (d) diphenyl diselenide (DPDS), and (e) nano selenium (NanoSe) (n = 8/group). The levels of protein expression (f) as measured by using an automated in-silico method with ImageJ (see Supplemental data Figure S4).
Figure 8.
Figure 8.
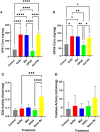
Quantification of testicular antioxidant enzyme levels or corresponding specific activity in male C57BL/6 receiving dietary Se using ELISA. Data represent the mean ± SEM of total enzymic protein (ng/mg tissue) or enzymic activity (U/min/mg protein) in homogenates of isolated testis. Treatment groups are control, sodium selenite (NaSe), Se-methyl-selenocysteine (Met), diphenyl diselenide (DPDS), and nano selenium (NanoSe) (n = 8/group). Between group differences were determined by one-way analysis of variance (ANOVA) (*p ≤ 0.05, **p ≤ 0.01, ***p ≤ 0.001, ****p ≤ 0.0001) since all data sets satisfied normalcy criteria.
Figure 9.
Figure 9.
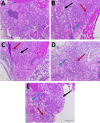
Haematoxylin and Eosin (H&E) staining of thyroid tissues. Data shows representative thyroid (n = 8 mice per group) from (a) Control, (b) NaSe, (c) Met, (d) DPDS and (e) NanoSe. Thyroids from Se-supplemented mice commonly presented with marginal vacuolations (Black arrow), fatty deposits (Blue arrow) and nuclear clusters (Red arrow) in comparison to non-Se treated mice (Control). Images represent at least 2 fields of view for each thyroid imaged at 200x magnification; scale bars shown represent 100 µm.
Figure 10.
Figure 10.
Immunohistochemical staining of thyroid tissues for DIO1 selenoprotein. Thyroid tissue from all groups (n = 8 mice per group). (a) Control, (b) NaSe, (c) Met, (d) DPDS, and (e) NanoSe were sectioned and assessed for positive DIO1 expression all compared with (f) isotype (negative) control. Red arrows show positive staining in follicular epithelium (Figure 2a–e). Immune + -staining of colloidal material (Black arrow) was also observed in thyroids (Figure B). Images were captured at 100x magnification, representing n ≥ 3 sections per treatment and 3 independent fields of view. Immune + -staining was optimised and the staining around the follicular membrane was quantified using an in-silico approach using ImageJ as described in the Supplement Fig S4. Panel (g) semiquantitative data was plotted and compared using one-way ANOVA with Tukey’s post-hoc test; * p ≤ 0.05, ***p ≤ 0.001 and **** p ≤ 0.0001.
Figure 11.
Figure 11.
Assessing thyroid GPX1/4 and DIO1 tissue levels and circulating triiodothyronine (T3), thyroxine (T4) and thyroid stimulating hormone (TSH) in male C57BL/6 mice. Thyroids from mice in the various dietary groups were homogenised and then assessed for the level of (a) GPX, (b) GPX4 and (c) DIO protein determined with commercially sourced Enzyme-Linked Immunosorbent Assay (ELISA). Corresponding mouse plasma was separated by centrifugation and levels of (d) T3, (e) T4, (f) ratio T3/T4 and circulating (g) TSH were also determined with ELISA as described in the Methods. Data represent mean ± SD for control, sodium selenite (NaSe), Se-methyl-selenocysteine (Met) and diphenyl diselenide (DPDS) groups (n = 8/dietary treatment group) in ng/mg, pg/mL and ng/mL, respectively. P-values were generated, and group effects were determined by one-way analysis of variance (ANOVA) to establish statistical significance (*p ≤ 0.05; **p ≤ 0.01, ***p < 0.001).
Figure 12.
Figure 12.
Alpha (α)-diversity determined for microorganisms identified in mouse faeces from mice fed control or Se-enriched diets. Male mice were fed with standard chow or chow fortified with diphenyl diselenide (DPDS), Se-methyl-selenocysteine (Met), nanoparticulate elemental selenium (NanoSe), and sodium selenite (NaSe) (n = 8 mice/group). Measurements of (a) Richness, (b) Shannon; (c) Inverse Simpson; (d) Evaluations of Evenness were then conducted from complete microbiome data for stool isolated for each individual mouse in these dietary groups (n = 8 mice per group, each identified as an individual dot in the graphs). Microbiome analyses was conducted using DNA isolated from freshly isolated stool from the large colon.
Figure 13.
Figure 13.
Beta (β)-diversity analysis based on the 16S rDNA gene sequence in microorganisms isolated from mouse faeces. Treatment groups are coordinated to specific colour on the figure and represent diversity measurements for male mice in the control, diphenyl diselenide (DPDS), Se-methyl-selenocysteine (Met), nanoparticulate elemental selenium (NanoSe), and sodium selenite (NaSe) (n = 8/dietary treatment group). (a) Unweighted UniFrac principal component analysis (PCA) and (b) Weighted UniFrac PCA at the genus level. Distances between the symbols on the ordination plot reflect the relative dissimilarities in the community structures. Unifrac component analyses were then conducted from complete microbiome data for stool isolated for each mouse in these different dietary groups (identified as an individual colour-coded dot on the graph).
Figure 14.
Figure 14.
Compositional data analyses-based PCA in microorganisms isolated from mouse faeces of the C57BL/6. Treatment groups shown represent control, diphenyl diselenide (DPDS), Se-methyl-selenocysteine (Met), nanoparticulate elemental selenium (NanoSe), and sodium selenite (NaSe) (n = 8 mice per group). Panel (a) shows compositional data analysis of all-groups, (b) control-DPDS; (c) control-Met; (d) control-NanoSe; (e) control-NaSe group comparisons. Compositional analyses were then conducted from complete microbiome data for stool isolated for each mouse in these different dietary groups (identified as an individual colour-coded dot on the graph).
Figure 15.
Figure 15.
Compositional abundance differences at the ASV taxonomical level in microorganisms isolated from mouse faeces of the C57BL/6. Male mice (n = 8/dietary treatment group) were supplemented with standard chow or chow fortified with diphenyl diselenide (DPDS) (a), Se-methyl-selenocysteine (Met) (b) sodium selenite (NaSe) (c) and nanoparticulate elemental selenium (NanoSe) (d). Differences in compositional abundance were then conducted from complete microbiome data for stool isolated for each mouse in these different dietary groups (identified as an individual dot on the graph). Significant differentially abundant ASVs are coloured in red. Microbiome statistical comparisons and data visualisations were performed using the packages in R v.4.2.1 (R Core Team, 2022).
Figure 16.
Figure 16.
Compositional abundance differences at the genus taxonomical level in microorganisms isolated from mouse faeces of the C57BL/6. Male mice (n = 8/dietary treatment group) were supplemented with standard chow or chow fortified with diphenyl diselenide (DPDS) (a), the Se-methyl-selenocysteine (Met) (b) sodium selenite (NaSe) (c) and nanoparticulate elemental selenium (NanoSe) (d) Significant differentially abundant ASVs are coloured in red. Microbiome statistical comparisons and data visualisations were performed using the packages in R v.4.2.1 (R Core Team, 2022).

References

    1. Ullah H, Liu G, Yousaf B, et al. . Developmental selenium exposure and health risk in daily foodstuffs: a systematic review and meta-analysis. Ecotoxicol Environ Saf. 2018;149:291–306. doi:10.1016/j.ecoenv.2017.11.056 - DOI - PubMed
    1. Adeniran SO, Zheng P, Feng R, et al. . The antioxidant role of selenium via GPx1 and GPx4 in LPS-induced oxidative stress in bovine endometrial cells. Biol Trace Elem Res. 2022;200(3):1140–1155. doi:10.1007/s12011-021-02731-0 - DOI - PubMed
    1. Schmutzler C, Mentrup B, Schomburg L, et al. . Selenoproteins of the thyroid gland: expression, localization and possible function of glutathione peroxidase 3. bchm. 2007;388(10):1053–1059. doi:10.1515/BC.2007.122 - DOI - PubMed
    1. Broome CS, McArdle F, Kyle JA, et al. . An increase in selenium intake improves immune function and poliovirus handling in adults with marginal selenium status. Am J Clin Nutr. 2004;80(1):154–162. doi:10.1093/ajcn/80.1.154 - DOI - PubMed
    1. Li Z, Dong Y, Chen S, et al. . Organic selenium increased gilts antioxidant capacity, immune function, and changed intestinal microbiota. Front Microbiol. 2021;12:723190. doi:10.3389/fmicb.2021.723190. - DOI - PMC - PubMed