. 2025 Apr 10;15(4):241.
doi: 10.3390/bios15040241.

Real-Time Precise Prediction Dispersion Turning Point of Optical Microfiber Coupler Biosensor with Ultra-High Sensitivity and Wide Linear Dynamic Range

Affiliations

Real-Time Precise Prediction Dispersion Turning Point of Optical Microfiber Coupler Biosensor with Ultra-High Sensitivity and Wide Linear Dynamic Range

Haiyang Yu et al. Biosensors (Basel). .

Abstract

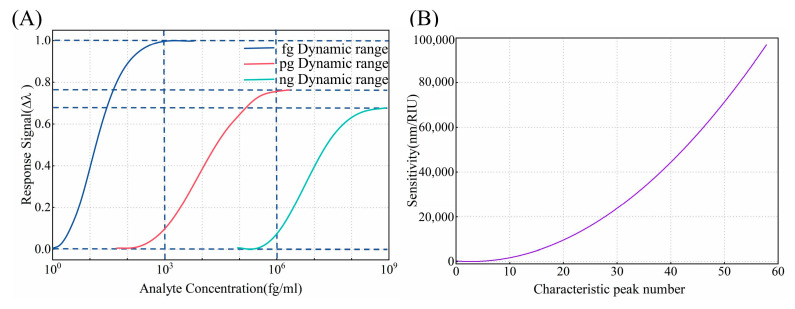
Optical microfiber biosensors demonstrate exceptionally ultra-high sensitivity at the dispersion turning point (DTP). However, the DTP is highly susceptible to variations in dimensional and external environmental factors, and the spectral response is mismatched from preparation in air to application in a liquid environment, making the DTP difficult to control effectively. In this work, we propose a method that bridges the relationship between the interference spectra of air and aqueous environments. By counting the interference peaks in air, we can accurately predict the DTP position in liquids. Meanwhile, it provides a new balance between sensitivity and wide linear dynamic range, achieving wide dynamic range detection across various concentrations. The optical microfiber coupler (OMC) is fabricated using the hydrogen-oxygen flame melting tapering method. In addition, the concentration, temperature, and solvent used for the sensor's biofunctional layer are optimized. Finally, in refractive index sensing, a maximum sensitivity of 1.17 × 10⁵ ± 0.038 × 10⁵ nm/RIU is achieved. For biosensing, a wide dynamic range detection of cardiac troponin I (cTnI) is realized at concentrations of 12-48 ng/mL, 120-480 pg/mL, and 120-480 fg/mL.

Keywords: dispersion turning point; linear dynamic range; mode interference; optical microfiber coupler biosensor; ultra-high sensitivity.


Conflict of interest statement

Author Yang Xu and Yihui Wu was employed by the company GD Changguang Zhongke Bio Co., Ltd., Foshan, Guangdong. The remaining authors declare that the research was conducted in the absence of any commercial or financial relationships that could be construed as a potential conflict of interest.

Figures

Figure 1
Figure 1
(A) Schematic diagram of the microfiber coupler sensor. (B) Calculated effective RIs of the guided even and odd modes in x-polarization and y-polarization. (C) The ΔG curves within the wavelength range of 1000–1200 nm for waist diameters of 2.4 μm and 2.6 μm. (D) The ΔBΔn curves within the wavelength range of 1000–1200 nm for waist diameters of 2.4 μm and 2.6 μm. (E) The sensitivity curves within the wavelength range of 1000–1300 nm for refractive indices of 1.333 with waist diameters of 2.4 μm, 2.5 μm, 2.6 μm. (F) The effective refractive index of the even mode in x-polarization for refractive indices of 1, 1.333, and 1.334 within the wavelength range of 900–1200 nm. (G) The ΔG curves within the wavelength range of 1000–1200 nm for refractive indices of 1.333, 1.334. (H) The sensitivity curves within the wavelength range of 1200–1300 nm for a waist diameter of 2.6 μm with refractive indices of 1.333, 1.334, and 1.335.
Figure 2
Figure 2
(A) The simulated transmission spectrum of the OMC with a waist diameter of 3.2 μm in air. (B) The simulated transmission spectrum of the OMC with a waist diameter of 2.6 μm in air. (C) The relationship curve between the number of interference peaks and the waist diameter for the OMC in air. (D) The three-dimensional surface plot showing the relationship between SRI, the number of interference peaks, and the wavelength position of the DTP. (E) The simulated transmission spectrum at the DTP for SRI = 1.393 with a waist diameter of 2.6 μm.
Figure 3
Figure 3
(A) System diagram of the OMC fabrication apparatus. (B) Illustration of the experimental setup.
Figure 4
Figure 4
(A) The functional layer thicknesses of 10 nm, 15 nm, and 20 nm are evaluated in relation to the effective refractive index of x-polarization even mode. (B) The sensitivity curves are analyzed for functional layer thicknesses of 10 nm, 15 nm, and 20 nm within the wavelength range of 1000–1100 nm. (C) The wavelength shift near 810 nm is analyzed for APTES concentrations of 0.5%, 1%, and 2%. (D) The wavelength shift is evaluated for different antibody concentrations immobilized on OMC. (E) The wavelength shifts are analyzed for the sequential addition of 10 μg/mL antibodies three times and the subsequent addition of 20 μg/mL antibodies.
Figure 5
Figure 5
Light intensity loss and wavelength shift of OMCs at different temperatures.
Figure 6
Figure 6
(A) The experimental transmission spectrum of the OMC with a waist diameter of 2.6 μm in air. (B) The experimental transmission spectrum of the OMC with a waist diameter of 2.6 μm in water. (C) The experimental transmission spectrum at the DTP for SRI = 1.393 with a waist diameter of 2.6 μm. (D) A scanning electron microscopy (SEM) image of the OMC.
Figure 7
Figure 7
(A) The number of interference peaks in air is 20, transmission spectral response to SRI range from 1.3333 to 1.3337, different colored arrows are to guide the shift of interference peaks as ambient RI increases, as follows. (B) Wavelength shifts of interference peaks versus SRI, peaks A, B, C, D, and E correspond to different colored arrows, as follows (C) The number of interference peaks in air is 30, transmission spectral response to SRI range from 1.3333 to 1.3337. (D) Wavelength shifts of interference peaks versus SRI. (E) The number of interference peaks in air is 65, transmission spectral response to SRI range from 1.3333 to 1.3337. (F) Wavelength shifts of interference peaks versus SRI.
Figure 8
Figure 8
(A) The sensitivity versus the number of characteristic peaks in air. (B) The schematic diagram of the dynamic range for different concentrations.
Figure 9
Figure 9
(A) The number of interference peaks in air is 20, transmission spectral response of different cTnI concentrations, different colored arrows are to guide the shift of interference peaks as cTnI antigen concentration increases, as follows. (B) Linear response of cTnI binding to the anti-cTnI immobilized on the surface of the OMC at a concentration in the range of 12–48 ng/mL (n = 3), peaks A, B, and C, correspond to different colored arrows, as follows. (C) The number of interference peaks in air is 30, transmission spectral response of different cTnI concentrations. (D) Linear response of cTnI binding to the anti-cTnI immobilized on the surface of the OMC at a concentration in the range of 120–480 pg/mL (n = 3). (E) The number of interference peaks in air is 65, transmission spectral response of different cTnI concentrations. (F) Linear response of cTnI binding to the anti-cTnI immobilized on the surface of the OMC at a concentration in the range of 120–480 fg/mL (n = 3).

References

    1. Yang T., Chen S., He X., Guo H., Sun X. How to convincingly measure low concentration samples with optical label-free biosensors. Sens. Actuators B Chem. 2019;306:127568. doi: 10.1016/j.snb.2019.127568. - DOI
    1. Zhao Y., Tong R.-J., Xia F., Peng Y. Current status of optical fiber biosensor based on surface plasmon resonance. Biosens. Bioelectron. 2019;142:111505. doi: 10.1016/j.bios.2019.111505. - DOI - PubMed
    1. Tripathi S.M., Bock W.J., Mikulic P., Chinnappan R., Ng A., Tolba M., Zourob M. Long period grating based biosensor for the detection of Escherichia coli bacteria. Biosens. Bioelectron. 2012;35:308–312. doi: 10.1016/j.bios.2012.03.006. - DOI - PubMed
    1. Liu G., Li K. Micro/nano optical fibers for label-free detection of abrin with high sensitivity. Sens. Actuators B Chem. 2015;215:146–151. doi: 10.1016/j.snb.2015.03.056. - DOI
    1. Liu X., Singh R., Zhang B., Caucheteur C., Santos N., Kumar S., Nedoma J., Marques C. Advanced fiber optic sensors for quantitative nitrite detection: Comparative analysis of plasmonic tilted fiber Bragg gratings and fiber optic tips with ion-imprinted polymers. Sens. Actuators Rep. 2024;8:100233. doi: 10.1016/j.snr.2024.100233. - DOI

LinkOut - more resources