

Untargeted Metabolomics Reveals Acylcarnitines as Major Metabolic Targets of Resveratrol in Breast Cancer Cells
- PMID: 40278380
- PMCID: PMC12029535
- DOI: 10.3390/metabo15040250
Untargeted Metabolomics Reveals Acylcarnitines as Major Metabolic Targets of Resveratrol in Breast Cancer Cells
Abstract
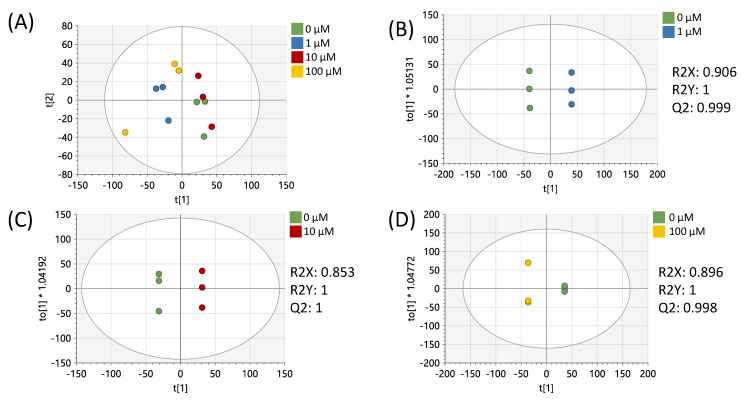
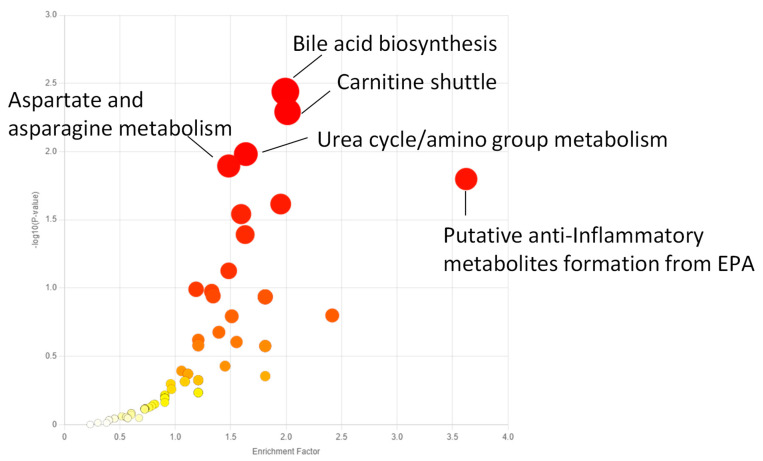
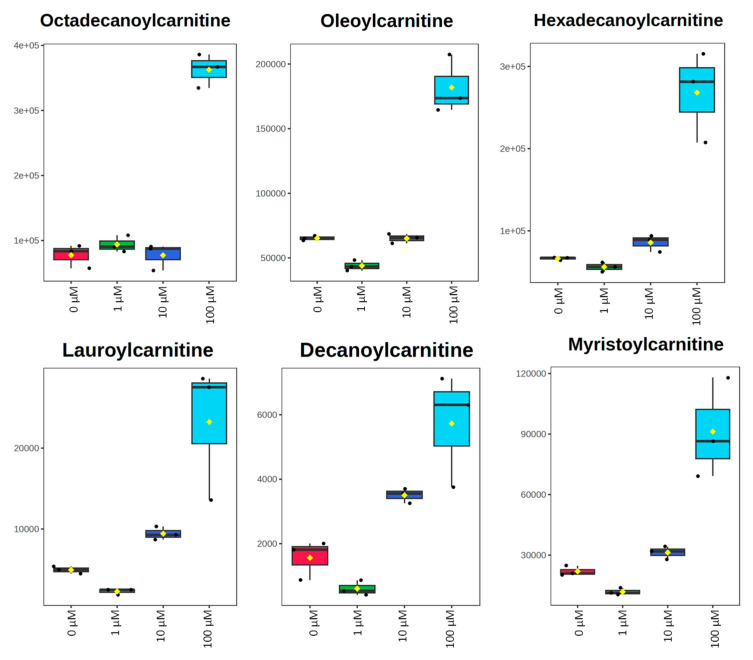
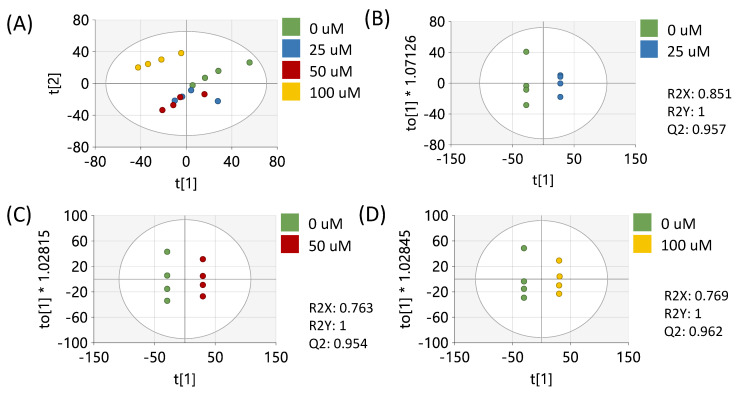
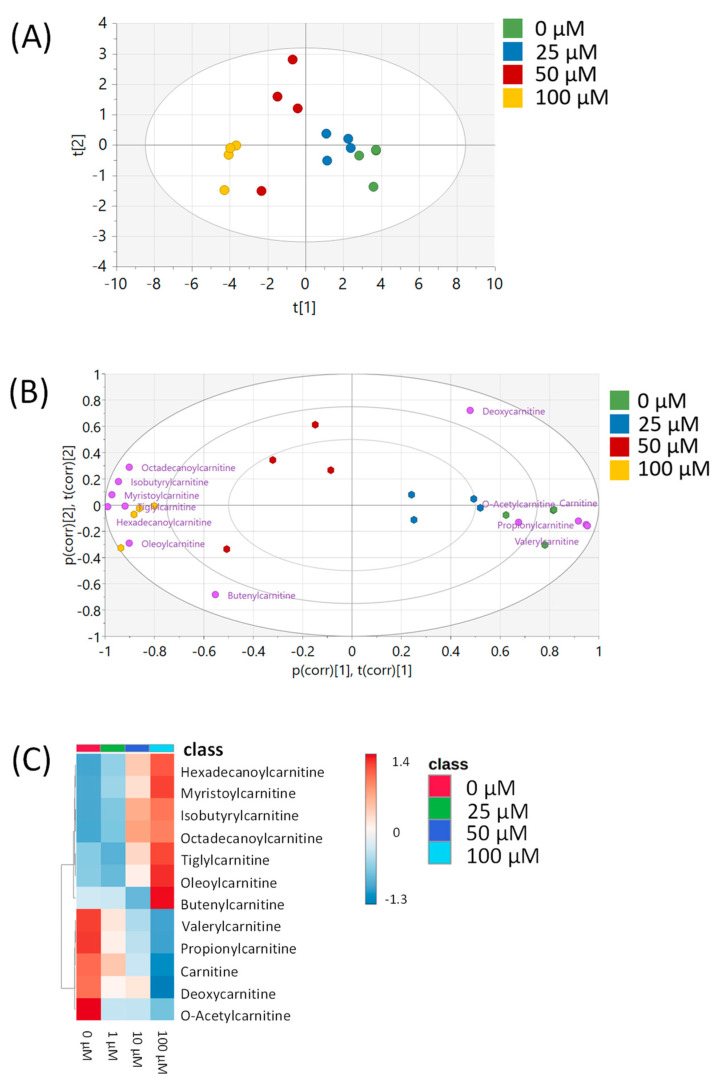
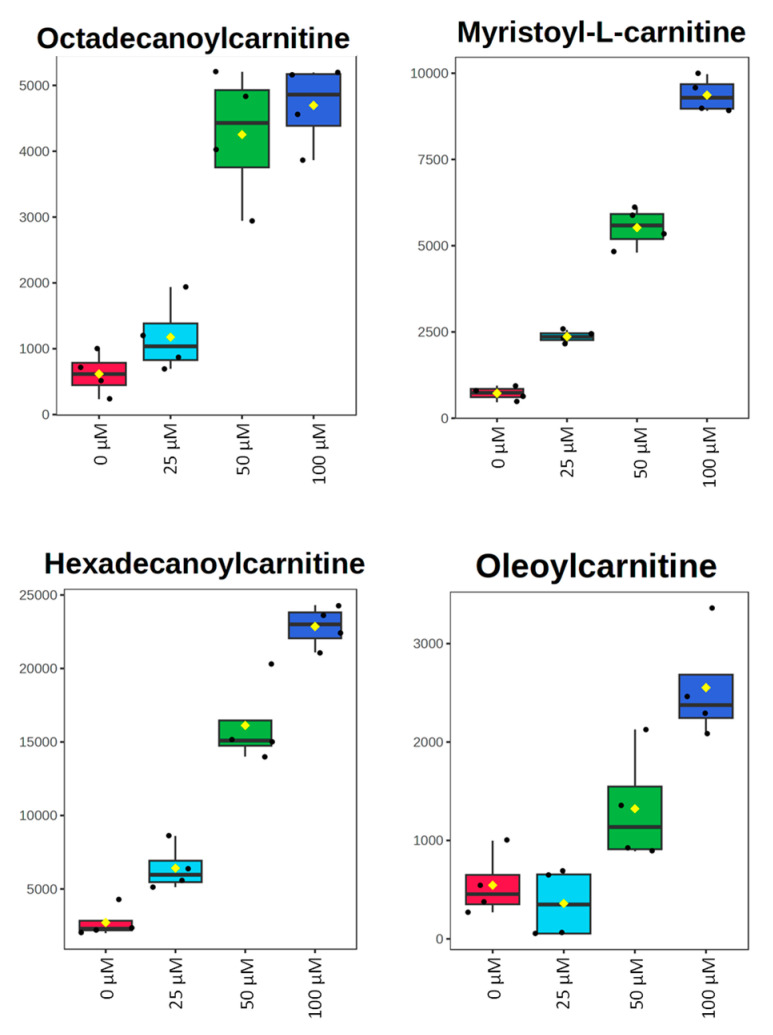
Background/Objectives: Millions of new diagnoses of breast cancer are made each year, with many cases having poor prognoses and limited treatment options, particularly for some subtypes such as triple-negative breast cancer. Resveratrol, a naturally occurring polyphenol, has demonstrated many anticancer properties in breast cancer studies. However, the mechanism of action of this compound remains elusive, although prior evidence suggests that this compound may work through altering cancer cell metabolism. Our objective for the current study was to perform untargeted metabolomics analysis on resveratrol-treated breast cancer cells to identify key metabolic targets of this compound. Methods: MCF-7 and MDA-MB-231 breast cancer cells were treated with varying doses of resveratrol and extracted for mass spectrometry-based untargeted metabolomics. Data preprocessing and filtering of metabolomics data from MCF-7 samples yielded 4751 peaks, with 312 peaks matched to an in-house standards library and 3459 peaks matched to public databases. Results: Pathway analysis in MetaboAnalyst identified significant (p < 0.05) metabolic pathways affected by resveratrol treatment, particularly those involving steroid, fatty acid, amino acid, and nucleotide metabolism. Evaluation of standard-matched peaks revealed acylcarnitines as a major target of resveratrol treatment, with long-chain acylcarnitines exhibiting a 2-5-fold increase in MCF-7 cells and a 5-13-fold increase in MDA-MB-231 cells when comparing the 100 µM treated cells to vehicle-treated cells (p < 0.05, VIP > 1). Notably, doses below 10 µM showed an opposite effect, possibly indicating a biphasic effect of resveratrol due to a switch from anti-oxidant to pro-oxidant effects as dose levels increase. Conclusions: These findings suggest that resveratrol induces mitochondrial metabolic reprogramming in breast cancer cells in a dose-dependent manner. The biphasic response indicates a potential optimal dosage for therapeutic effectiveness. Further research is warranted to explore the mechanisms underlying these metabolic alterations and their implications for precision nutrition strategies in cancer treatment.
Keywords: breast cancer; metabolomics; mitochondria; resveratrol; triple-negative.
Conflict of interest statement
The authors declare no conflicts of interest.
Figures

Similar articles
-
Metabolomic analysis of resveratrol-induced effects in the human breast cancer cell lines MCF-7 and MDA-MB-231.OMICS. 2011 Jan-Feb;15(1-2):9-14. doi: 10.1089/omi.2010.0114. Epub 2011 Jan 17. OMICS. 2011. PMID: 21241168
-
Metabolic Response of Triple-Negative Breast Cancer to Folate Restriction.Nutrients. 2021 May 13;13(5):1637. doi: 10.3390/nu13051637. Nutrients. 2021. PMID: 34068120 Free PMC article.
-
Metabolomics Profiling Reveals the Role of PEDF in Triple-Negative Breast Cancer Cell MDA-MB-231 under Glycaemic Loading.Pharmaceutics. 2023 Feb 6;15(2):543. doi: 10.3390/pharmaceutics15020543. Pharmaceutics. 2023. PMID: 36839865 Free PMC article.
-
Metabolomics reveals metabolic targets and biphasic responses in breast cancer cells treated by curcumin alone and in association with docetaxel.PLoS One. 2013;8(3):e57971. doi: 10.1371/journal.pone.0057971. Epub 2013 Mar 5. PLoS One. 2013. PMID: 23472124 Free PMC article.
-
The Anti-Cancer Effects of Mitochondrial-Targeted Triphenylphosphonium-Resveratrol Conjugate on Breast Cancer Cells.Pharmaceuticals (Basel). 2022 Oct 15;15(10):1271. doi: 10.3390/ph15101271. Pharmaceuticals (Basel). 2022. PMID: 36297383 Free PMC article.
Cited by
-
Targeting Mitochondrial Quality Control for the Treatment of Triple-Negative Breast Cancer: From Molecular Mechanisms to Precision Therapy.Biomolecules. 2025 Jul 5;15(7):970. doi: 10.3390/biom15070970. Biomolecules. 2025. PMID: 40723842 Free PMC article. Review.
References
-
- Petrucelli N., Daly M.B., Pal T. BRCA1- and BRCA2-Associated Hereditary Breast and Ovarian Cancer Summary Genetic counseling Suggestive Findings. Gene Rev. 1998:1–37.
Grants and funding
LinkOut - more resources
Full Text Sources
Miscellaneous
