. 2025 Apr 25;11(17):eads1875.
doi: 10.1126/sciadv.ads1875. Epub 2025 Apr 25.

Single-cell morphology encodes functional subtypes of senescence in aging human dermal fibroblasts

Affiliations

Single-cell morphology encodes functional subtypes of senescence in aging human dermal fibroblasts

Pratik Kamat et al. Sci Adv. .

Abstract

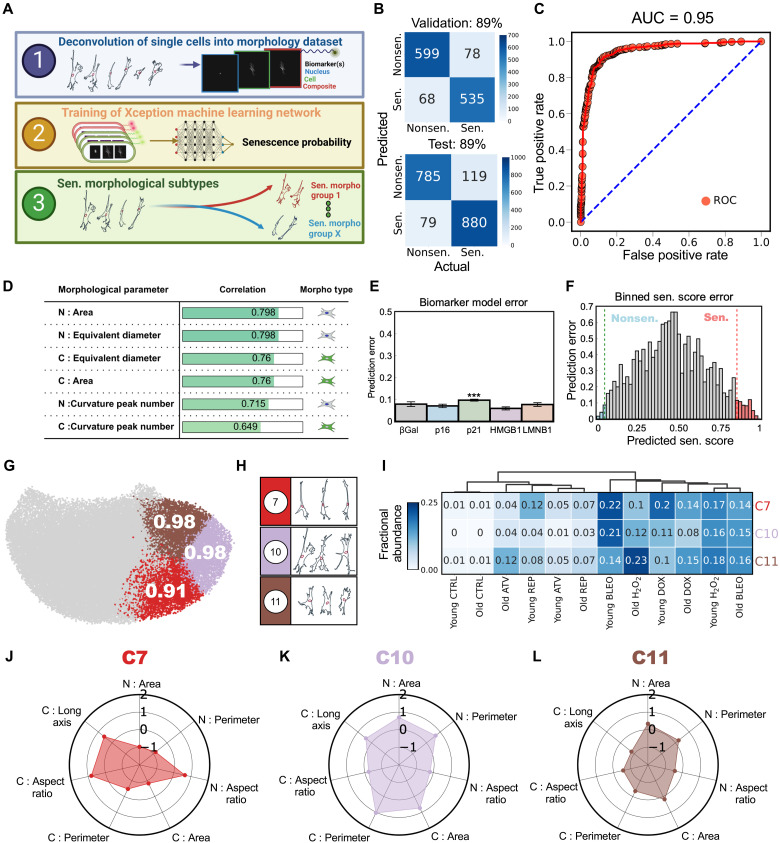
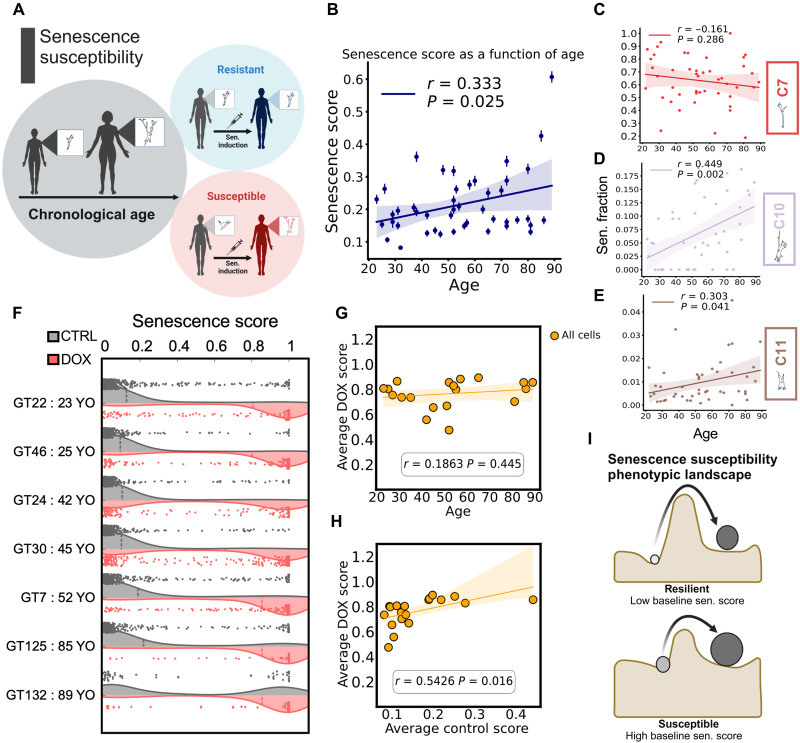
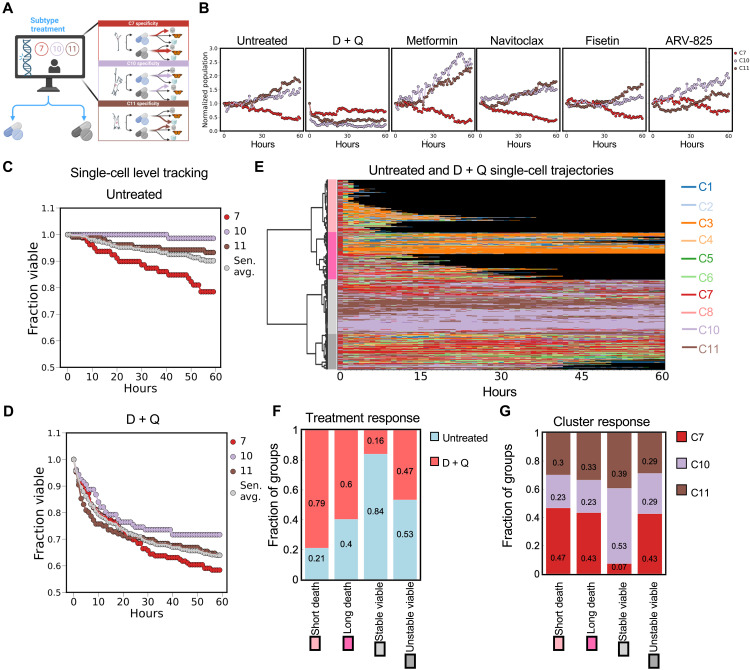
Cellular senescence, a hallmark of aging, reveals context-dependent phenotypes across multiple biological length scales. Despite its mechanistic importance, identifying and characterizing senescence across cell populations is challenging. Using primary dermal fibroblasts, we combined single-cell imaging, machine learning, several induced senescence conditions, and multiple protein biomarkers to define functional senescence subtypes. Single-cell morphology analysis revealed 11 distinct morphology clusters. Among these, we identified three as bona fide senescence subtypes (C7, C10, and C11), with C10 exhibiting the strongest age dependence within an aging cohort. In addition, we observed that a donor's senescence burden and subtype composition were indicative of susceptibility to doxorubicin-induced senescence. Functional analysis revealed subtype-dependent responses to senotherapies, with C7 being most responsive to the combination of dasatinib and quercetin. Our single-cell analysis framework, SenSCOUT, enables robust identification and classification of senescence subtypes, offering applications in next-generation senotherapy screens, with potential toward explaining heterogeneous senescence phenotypes based on the presence of senescence subtypes.


Figures

Fig. 1.
Fig. 1.. Cellular and nuclear morphologies are biomarkers for in vitro cellular senescence.
(A) Graphical illustration of experimental workflow to induce and characterize senescent cells. (B) Representative images of the immunofluorescence staining of five senescence-associated protein biomarkers across untreated (DMSO vehicle) and DOX-induced primary dermal fibroblast samples (23-year-old male). (C to G) Z-score fluorescence quantification relative to control of β-galactosidase (βGal) (C), p16 (D), p21 (E), HMGB1 (F), and LMNB1 (G) for young and old dermal fibroblast samples [n > 400 single cells per condition, means ± 95% confidence interval (CI), one-way ANOVA relative to age-matched control expression, P ≤ 0.001 relative to control]. (H) Heatmap of standard scaled expression of pro-inflammatory secretions for induction conditions. GM-CSF, granulocyte-macrophage colony-stimulating factor; IFN-γ, interferon-γ; IP-10, interferon γ induced protein 10 (also referred to as CXCL10); TNF-α, tumor necrosis factor–α. (I) Principal components analysis scatterplot of secretory profiles across uninduced and senescence-induced populations. Similar clustered groups are highlighted in red and blue transparent ovals. (J) Truncated waterfall plot of cellular and nuclear morphological feature enrichment to either untreated or senescence-induced samples across both ages (P ≤ 0.001 for all enrichments).
Fig. 2.
Fig. 2.. Single-cell morphology encodes heterogeneous senescence phenotypes.
(A) Schematic of the morphological analysis pipeline. (B) UMAP plot constructed using 88 morphological parameters across all conditions and age groups (n = 50,000 cells). Dots indicate individual cells. (C) Overlay of the 11 k-means clusters with representative cellular and nuclear morphologies. Contour lines indicate Gaussian kernel density function for each cluster. (D) Select morphological features layered on the UMAP space. Navy and yellow colors delineate low and high, respectively. UMAP-1 (x axis) was correlated with nuclear and cellular sizes, and UMAP-2 (y axis) was correlated with cell shapes. (E) Heatmap of fractional abundance for cells within each cluster for each experimental group (n > 1000 cells for each condition, dendrograms based on averaged Euclidean distances). (F) Contour overlay for nonsenescent and senescent classifications for βGal, p16, p21, HMGB1, and LMNB1. (G) Heatmap of the average biomarker expression for each cluster. (H) UMAP plots for imputed and measured biomarker expressions across young and old samples. (I) Imputation error using morphological parameters of single cells to predict protein biomarker expression (n > 500 cells for each biomarker, means ± 95% CI, multiple comparison Tukey test, P ≤ 0.001 for HMGB1 and LMNB1 relative to other biomarkers). Accuracy is defined as one minus the percent deviation from the model-predicted value divided by the ground truth value. (J) Heatmap of average imputation model accuracy for each biomarker in each morphological cluster (n > 200 cells per cluster per biomarker).
Fig. 3.
Fig. 3.. Machine learning and computational techniques to identify morphological senescence subtypes.
(A) Workflow for using cellular and nuclear textured images to develop single-cell resolution “senescence scores,” ranging from 0 to 1. Training was conducted on an age, induction, and biomarker balanced cohort of 6000 single cells (see the Materials and Methods for further details on senescence cutoffs and dataset creation). (B) Confusion matrix describing the accuracy of the trained Xception model on test and validation datasets. (C) ROC of the Xception model on the test dataset with an AUC of 0.95. (D) Top magnitude correlations between morphological parameters of single cells and their corresponding model-predicted senescence scores. (E) Average model prediction error associated with each senescence-associated protein biomarker. The error is defined as the magnitude difference between the predicted score and the ground truth score (n > 500 cells per biomarker, means ± 95% CI, Tukey multiple comparison test, P ≤ 0.001 p21 relative to other biomarkers). (F) Misclassification error associated with binned, model-predicted senescence scores (0.02 interval bins spanning 0 to 1). The error is defined as the fraction of cells within the bin in which the integer-rounded score does not match the true score (see the Materials and Methods for further details); bins with errors below 12% are highlighted in blue or red to highlight control and senescent high-confidence regimes. (G) Identification of three k-means morphological clusters (morphological subtypes) with average senescence scores within a 12% error. (H) Representative morphologies of the three senescent morphological subtypes. (I) Heatmap describing the differential enrichment among the three morphological senescence subtypes across all experimental conditions (average algorithm and Euclidean linkage). (J to L) Radar plots of standard scaled morphological properties of the three senescence subtypes (standard scaled with respect to all senescence subtypes).
Fig. 4.
Fig. 4.. Cellular senescence is a dynamic phenotype.
(A) Experimental design for analyzing the kinetics of senescence progression. (B and C) Representative morphologies for each time point for both DOX induction (B) and H2O2 induction (C). (D and E) Stacked area plots for k-means cluster enrichment as a function of induction time for DOX-induced (D) and H2O2-induced (E) cells. (F to I) Senescence fraction enrichment and subtype dynamics with time. Box plots showing the fraction of cells within senescent morphological subtypes compared to all clusters for DOX-induced (F) and H2O2-induced (H) samples (n > 1000 cells per day, means ± SEM). Line plots describe fractional distribution progression between the senescent morphological subtypes for DOX (G) and H2O2 (I) (shading indicates 95% CI around the mean). (J to N) Average Z-score quantification of βGal (J), p16 (K), p21 (L), HMGB1 (M), and LMNB1 (N) as a function of time post–senescence induction (shading indicates 95% CI around the mean). Twenty-three-year-old fibroblasts were used for this analysis.
Fig. 5.
Fig. 5.. Baseline morphology more effectively encodes senescence susceptibility than chronological age.
(A) Graphical depiction of hypothesized divergent senescence susceptibility responses as a function of age. (B) Average senescence score of primary dermal fibroblast samples as a function of chronological age fit to a univariate linear regression model (n > 300 cells per sample, means ± SEM). (C to E) Fraction of senescent cells within each of the three morphological subtypes as a function of chronological age fit to a univariate linear regression model (from top to bottom: clusters 7, 10, and 11, respectively). (F) Double violin plot for age-dispersed senescence score distributions at the baseline (gray) and after DOX induction (red) (n > 100 cells per condition). YO, years old. (G) Linear regression model of the average DOX-induced senescence score against the chronological age of the sample. (H) Linear regression model of the average DOX-induced senescence score against the average baseline senescence score of the sample. (I) Senescence susceptibility postulate where the induction response is governed by baseline morphological profiles.
Fig. 6.
Fig. 6.. Senescence subtypes encode differential responses to senotherapies.
(A) Visualization of hypothesized differential therapeutic response profiles of senescence morphological subtypes. (B) Quasi-population level counts of senescent cell morphological subtypes for untreated, D + Q, metformin, navitoclax, fisetin, and ARV-825 conditions as a function of treatment duration time. The cell number was normalized relative to the count at the baseline for each condition (t = 0 hours, n > 150 per subtype per treatment condition). (C and D) Single-cell trajectory viability analysis of morphological subtypes as a function of treatment duration time for untreated (C) and D + Q treatment (D) conditions. Cells from the induced population were differentiated into the various senescence morphological subtypes based on morphology at the baseline (t = 0, n > 100 cells per cluster, Mann-Whitney P < 0.05 for all group comparisons between clusters); cell trajectories were considered nonviable after entering k-means clusters 1, 2, or 3 and subsequently losing the tracking ability in subsequent frames. The gray “Sen. avg.” line represents the weighted average viability trends. (E) Heatmap displaying representative morphological evolution of single cells for untreated and D + Q treatment conditions starting in one of the three senescence subtypes. Colors coordinate with k-means cluster colors, with black indicative of a cell trajectory that has lost tracking (n = 480 cell samples, ward cluster method, Euclidean distance, threshold of 190). Dendrogram clustering was used to determine four overarching response modalities. (F) Untreated versus DOX enrichment in each of the four response modalities identified in the trajectory heatmap. (G) Morphological subtype enrichment in each of the four response modalities identified in the trajectory heatmap, normalized to cell count. DOX-induced senescent cells in the sample from the 23-year-old male were used for this analysis.

Update of

References

    1. Gorgoulis V., Adams P. D., Alimonti A., Bennett D. C., Bischof O., Bishop C., Campisi J., Collado M., Evangelou K., Ferbeyre G., Gil J., Hara E., Krizhanovsky V., Jurk D., Maier A. B., Narita M., Niedernhofer L., Passos J. F., Robbins P. D., Schmitt C. A., Sedivy J., Vougas K., von Zglinicki T., Zhou D., Serrano M., Demaria M., Cellular senescence: Defining a path forward. Cell 179, 813–827 (2019). - PubMed
    1. Hernandez-Segura A., Nehme J., Demaria M., Hallmarks of cellular senescence. Trends Cell Biol. 28, 436–453 (2018). - PubMed
    1. Wiley C. D., Campisi J., The metabolic roots of senescence: Mechanisms and opportunities for intervention. Nat. Metab. 3, 1290–1301 (2021). - PMC - PubMed
    1. Baker D. J., Wijshake T., Tchkonia T., Lebrasseur N. K., Childs B. G., Van De Sluis B., Kirkland J. L., Van Deursen J. M., Clearance of p16 Ink4a-positive senescent cells delays ageing-associated disorders. Nature 479, 232–236 (2011). - PMC - PubMed
    1. Di Micco R., Krizhanovsky V., Baker D., d’Adda di Fagagna F., Cellular senescence in ageing: From mechanisms to therapeutic opportunities. Nat. Rev. Mol. Cell Biol. 22, 75–95 (2021). - PMC - PubMed