. 2025 Apr 25;11(17):eadp0451.
doi: 10.1126/sciadv.adp0451. Epub 2025 Apr 25.

Prolonged airway explant culture enables study of health, disease, and viral pathogenesis

Affiliations

Prolonged airway explant culture enables study of health, disease, and viral pathogenesis

Rhianna E Lee-Ferris et al. Sci Adv. .

Abstract

In vitro models play a major role in studying airway physiology and disease. However, the native lung's complex tissue architecture and nonepithelial cell lineages are not preserved in these models. Ex vivo tissue models could overcome in vitro limitations, but methods for long-term maintenance of ex vivo tissue have not been established. Here, we describe methods to culture human large airway explants, small airway explants, and precision-cut lung slices for at least 14 days. Human airway explants recapitulate genotype-specific electrophysiology; characteristic epithelial, endothelial, stromal, and immune cell populations; and model viral infection after 14 days in culture. These methods also maintain mouse, rabbit, and pig tracheal explants. Notably, intact airway tissue can be cryopreserved, thawed, and used to generate viable explants with recovery of function 14 days postthaw. These studies highlight the broad applications of airway tissue explants and their use as translational intermediates between in vitro and in vivo studies.


Figures
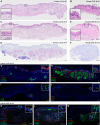
Fig. 1.
Fig. 1.. Human LAEs and SAEs exhibit native tissue architecture and characteristic epithelial, mesenchymal, and immune cell types after 14 days in culture.
(A and B) Hematoxylin and eosin (H&E) staining of human LAEs (A) and SAEs (B) immediately after dissection [day 0 (d0)]. Representative of n = 7 and 5 donors, respectively. (C and D) H&E (C) and AB-PAS (D) staining of a human LAE explant after 14 days in culture. Arrowheads in (D) indicate SMGs. Representative of n = 17 donors. (E and F) H&E (E) and AB-PAS (F) of a human SAE explant after 14 days in culture. Representative of n = 13 donors. (G to J) IF localization of α-tubulin, MUC5B, and MUC5AC (G); PECAM1, ACTA2, and PTPRC (H); CD68 (I); and CD20 and CD3 (J) in day 14 LAE explants. Arrowheads in (G) indicate SMGs. [(G) to (J)] Representative of n = 3 donors. (K to M) IF localization of α-tubulin, MUC5B, and MUC5AC (K); PECAM1, ACTA2, and PTPRC (L); and LAMP3, pro-SPB, and AGER (M) in day 14 SAE explants. [(K) to (M)] Representative of n = 3 donors. Scale bars, 100 μm.
Fig. 2.
Fig. 2.. Human PCLSs preserve diverse cell lineages for 14 days of culture on Gelfoam.
(A) WST-8 viability assessment of human PCLSs cultured at ALI on Gelfoam or under traditional submerged methods. n = 3 donors; three replicates per donor. Gelfoam-cultured PCLSs had significantly greater viability using a linear mixed-effects model with the donor as a random effects factor. *P < 0.05. (B and C) H&E histology of day 0 (B) and day 14 (C) human PCLSs. [(B) and (C)] Representative of n = 8 donors. (D to F) IF localization of CD68, AGER, and LAMP3 in human PCLSs at day 0 (D), day 7 (E), and day 14 (F). [(D) to (F)] Representative of n = 3 donors. (G and H) IF localization of KI67 with CD68 and LAMP3 (G) and with CD3 and platelet-derived growth factor receptor A (PDGFRA) (H) in day 14 human PCLSs. [(G) and (H)] Representative of n = 3 donors. Scale bars, 100 μm.
Fig. 3.
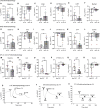
Fig. 3.. Human airway explants retain genotype-specific electrophysiology for 14 days in culture.
(A to F) Electrophysiology of human LAE explants at days 1 and 2 and days 14 and 15. (A) Basal short circuit current (Isc) and ΔIsc in response to (B) Amil, (C) FSK, (D) CFTRinh-172, (E) uridine 5′-triphosphate (UTP), and (F) bumetanide (Bumet). n = 5 to 6 donors (represented by different colored dots); one to two replicates per donor. (G to L) Electrophysiology of human SAE explants at days 1 and 2 and days 14 and 15. (G) Basal Isc and ΔIsc in response to (H) Amil, (I) FSK, (J) CFTRinh-172, (K) UTP, and (L) bumetanide. n = 6 donors (represented by different colored dots); one to two replicates per donor. (M to R) Electrophysiology of human CF versus non-CF LAE explants at day 14. (M) Basal Isc and ΔIsc in response to (N) Amil, (O) FSK, (P) CFTRinh-172, (Q) UTP, and (R) bumetanide. n = 5 non-CF and 6 CF donors (represented by different colored dots); one to two replicates per donor. (S to U) Representative Ussing tracing of day 14 human LAE explant (S), SAE explant (T), and CF LAE explant (U). [(A) to (R)] Unpaired t test. *P < 0.05 and **P < 0.01. ns, nonsignificant.
Fig. 4.
Fig. 4.. scRNA-seq of LAE, SAE, and PCLS models over time.
(A) Schematic of scRNA-seq on LAEs, SAEs, and PCLSs at day 0 (fresh), day 2, and day 14. (B) Uniform Manifold Approximation and Projection indicating 33 identified cell clusters. (C to E) Dot plots showing the top differentially expressed genes in epithelial (C), endothelial and stromal (D), and immune cell (E) clusters.
Fig. 5.
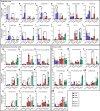
Fig. 5.. Cell population dynamics over time in the LAE, SAE, and PCLS model.
Proportion of (A) cluster 2, basal cells; (B) cluster 11, proliferating basal cells; (C) cluster 4, suprabasal cells; (D) cluster 9, suprabasal cells; (E) cluster 20, suprabasal cells; (F) cluster 5, secretory cells; (G) cluster 12, SMG duct cells; (H) cluster 13, multiciliated cells; (I) cluster 15, multiciliated cells; (J) cluster 16, AT2 cells; (K) cluster 25, AT1 cells; (L) cluster 30, PNECs and ionocytes; (M) cluster 18, myofibroblasts; (N) cluster 1, EC general capillary cells; (O) cluster 19, EC venous systemic cells; (P) cluster 7, AF1; (Q) cluster 14, AF2; (R) cluster 8, pericytes; (S) cluster 26, pericytes; (T) cluster 17, EC aerocyte capillary cells; (U) cluster 27, lymphatic ECs; (V) cluster 0, T cells; (W) cluster 24, plasma cells; (X) cluster 21, classical monocytes; (Y) cluster 10, macrophages; (Z) cluster 31, proliferating T cells; (AA) cluster 28, mast cells; and (AB) cluster 29, B cells in each scRNA-seq sample. [(A) to (AB)] n = 3 donors; one replicate per donor. Statistical testing was performed on a sample-wise cell count matrix with a generalized linear model (GLM) fit and negative binomial (NB) distribution, using a quasi-likelihood (QL) F test. *False discovery rate (FDR) < 0.05, **FDR < 0.01, and ***FDR < 0.001. Unmarked comparisons are nonsignificant. See table S1 for a full summary of statistical testing.
Fig. 6.
Fig. 6.. Viable airway explants can be made from diverse animal models.
(A to C) H&E histology of day 0 (A) mouse, (B) rabbit, and (C) pig tracheal explants. (D to F) H&E histology of day 14 (D) mouse, (E) rabbit, and (F) pig tracheal explants. Scale bars, 25 μm. Representative of n = 3 mice [(A) and (D)], 3 rabbits [(B) and (E)], and 4 pigs [(C) and (F)]. (G to L) Time course of rabbit tracheal explant electrophysiology at day 7, day 14, and days 20 and 21. (G) Basal Isc and change in ΔIsc in response to (H) Amil, (I) FSK, (J) CFTRinh-172, (K) UTP, and (L) bumetanide. n = 4 to 6 animals (represented by different colored dots); one to two replicates per animal. (M) Representative Ussing tracing of a day 14 rabbit tracheal explant. (N to S) Electrophysiology of CF versus wild-type rabbit tracheal explants at day 14. (N) Basal Isc and ΔIsc in response to (O) Amil, (P) FSK, (Q) CFTRinh-172, (R) UTP, and (S) bumetanide. n = 4 to 5 animals (represented by different colored dots); one to two replicates per animal. (T) Representative Ussing tracing of a CF rabbit tracheal explant at day 14. [(G) to (L)] One-way analysis of variance (ANOVA) with Tukey’s posttest. [(N) to (S)] Unpaired t test. *P < 0.05, **P < 0.01, and ***P < 0.001.
Fig. 7.
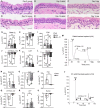
Fig. 7.. Airway explants can be made from cryopreserved tissue.
(A to D) H&E histology of cryopreserved/thawed human LAE explants at day 0 (A), day 2 (B), day 7 (C), and day 14 (D) postthaw. Scale bars, 50 μm. (A to D) Representative of n = 3 donors. (E to H) IF localization of KRT5, KI67, and α-tubulin in cryopreserved/thawed human LAE explants at day 0 (E), day 2 (F), day 7 (G), and day 14 (H) postthaw. Scale bars, 50 μm. [(E) to (H)] Representative of n = 3 donors. (I to L) IF localization of EGFP-FOXJ1 mouse tracheal explants made from cryopreserved tissue at day 0 (I), day 2 (J), day 7 (K), and day 14 (L) postthaw. Scale bars, 50 μm. [(I) to (L)] Representative of n = 3 mice. (M to R) Electrophysiology of human LAE explants made from fresh tissue at day 14 or cryopreserved tissue at day 13 and day 14 postthaw. (M) Basal Isc. Change in ΔIsc in response to (N) Amil, (O) FSK, (P) CFTRinh-172, (Q) UTP, and (R) bumetanide. n = 5 to 6 donors (represented by different color dots); one to two replicates per donor. (S) Representative Ussing tracing of a human LAE explants made from cryopreserved tissue at day 14 postthaw. [(M) to (R)] Unpaired t test.
Fig. 8.
Fig. 8.. Viral infection in human LAE, SAE, and PCLS models.
(A to C) Viral infection of human LAEs with (A) SeV-GFP after 45 days in culture, (B) RSV-GFP after 45 days in culture, or (C) the D614G variant of SARS-CoV-2 after 29 days in culture. IF localization of GFP (A and B) or SARS-CoV-2 (C) at 4 dpi. Scale bars, 100 μm. [(A) to (C)] Representative of n = 2 donors; two replicates per donor. (D and E) Fluorescent RNA in situ hybridization of human LAEs (D) and SAEs (E) inoculated with the D614G variant of SARS-CoV-2 after 25 days in culture. Stained at 4 dpi for FOXJ1 (red), SCGB1A1 (cyan), and SARS-CoV-2 (green). Nuclei counterstained with 4′,6-diamidino-2-phenylindole. Scale bars, 100 μm. [(D) and (E)] Representative of n = 3 donors. (F and G) Log base 2 of the relative copy number of SARS-CoV-2 nucleocapsid genes N1 (F) and N2 (G) measured by quantitative real-time polymerase chain reaction (qRT-PCR) and compared to a standard curve in human LAE and SAE explants at 3 dpi. n = 3 donors; one replicate per donor. (H and I) Log base 2 of the relative gene expression of interferon stimulated genes ISG15 (H) and MX1 (I) measured by qRT-PCR in human LAE and SAE explants at 3 dpi. The fold change (FC) in gene expression was normalized to TBP expression. n = 3 donors; one replicate per donor. (J) Representative fluorescent RNA in situ hybridization of human PCLSs inoculated with the D614G variant of SARS-CoV-2 after 7 days in culture. Scale bars, 100 μm. Representative of n = 4 donors. [(F) to (I)] Data were log transformed before statistical testing due to unequal variances among samples and analyzed using a linear mixed-effects model with the donor as a random effect factor. *P < 0.05, **P < 0.01, and ***P < 0.001.

Update of

References

    1. Fulcher M. L., Randell S. H., Human nasal and tracheo-bronchial respiratory epithelial cell culture. Methods Mol. Biol. 945, 109–121 (2013). - PubMed
    1. Randell S. H., Fulcher M. L., O’Neal W., Olsen J. C., Primary epithelial cell models for cystic fibrosis research. Methods Mol. Biol. 742, 285–310 (2011). - PubMed
    1. Merkle H., Ditzinger G., Lang S., Peter H., Schmidt M., In vitro cell models to study nasal mucosal permeability and metabolism. Adv. Drug Deliv. Rev. 29, 51–79 (1998). - PubMed
    1. Wadell C., Björk E., Camber O., Permeability of porcine nasal mucosa correlated with human nasal absorption. Eur. J. Pharm. Sci. 18, 47–53 (2003). - PubMed
    1. Chemuturi N. V., Hayden P., Klausner M., Donovan M. D., Comparison of human tracheal/bronchial epithelial cell culture and bovine nasal respiratory explants for nasal drug transport studies. J. Pharm. Sci. 94, 1976–1985 (2005). - PubMed

LinkOut - more resources