. 2025 Apr 25;11(17):eadr4894.
doi: 10.1126/sciadv.adr4894. Epub 2025 Apr 25.

The P2X7R/NLRP3 inflammasome axis suppresses enthesis regeneration through inflammatory and metabolic macrophage-stem cell cross-talk

Affiliations

The P2X7R/NLRP3 inflammasome axis suppresses enthesis regeneration through inflammatory and metabolic macrophage-stem cell cross-talk

Haihan Gao et al. Sci Adv. .

Abstract

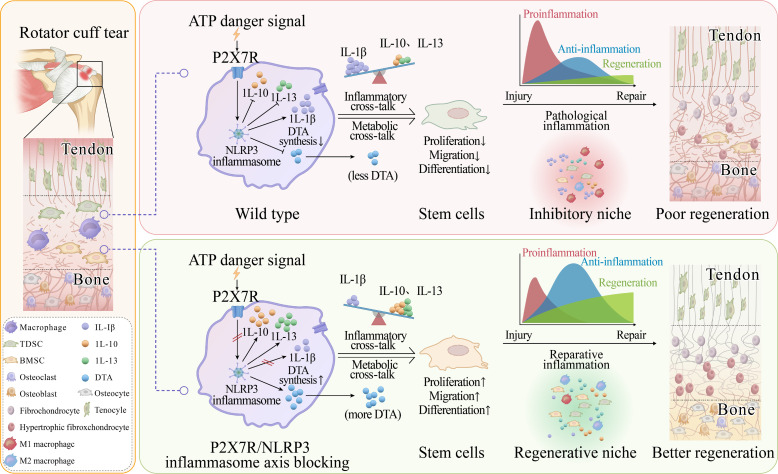
The regeneration of the enthesis remains a formidable challenge in regenerative medicine. However, key regulators underlying unsatisfactory regeneration remain poorly understood. This study reveals that the purinergic receptor P2X7 (P2X7R)/Nod-like receptor family protein 3 (NLRP3) inflammasome axis suppresses enthesis regeneration by amplifying IL-1β-mediated inflammatory cross-talk and suppressing docosatrienoic acid (DTA) metabolic cross-talk. NLRP3 inflammasomes were activated in macrophages following enthesis injury, thereby impairing the histological and functional recovery of the injured enthesis. Single-cell RNA sequencing (scRNA-seq) indicated that Nlrp3 knockout attenuated pathological inflammation and ameliorated the detrimental effects of IL-1β signaling cross-talk. Furthermore, NLRP3 inflammasomes suppressed the secretion of anti-inflammatory cytokines (IL-10 and IL-13) and DTA. The NLRP3 inflammasome-mediated secretome reduced differentiation and migration of stem cells. Neutralizing IL-1β or replenishing docosatrienoic acid accelerated enthesis regeneration. Moreover, conditional knockout of P2rx7 in myeloid cells attenuated NLRP3 inflammasome activation and facilitated enthesis regeneration. This study demonstrates that the P2X7R/NLRP3 inflammasome axis represents a promising therapeutic target for enthesis repair.


Figures

Fig. 1.
Fig. 1.. NLRP3 inflammasomes are activated in macrophages at the injured enthesis.
(A) Schematic diagram of RNA-seq and validation of DEGs. (B) PCA of the sham operation and RCTR groups. (C) Heat map of DEGs between the sham operation and RCTR groups. (D) Relative mRNA expression levels of Il1b, Caspase-1, Nlrp3, and P2rx7 in the enthesis of RCTR groups in comparison to sham operation groups. (E) Immunofluorescence (IF) staining of CD68 (red), NLRP3 (green), and caspase-1 (magenta) in the injured enthesis of wild-type and Nlrp3−/− mice at 3 dpi. Orange and green dashed squares represent enlarged images of the enthesis. Arrows indicate specks of NLRP3 and caspase-1. (F) Quantification of specks per macrophage in the injured enthesis of wild-type and Nlrp3−/− mice at 3 dpi. (G and H) The relative caspase-1 activity and IL-1β concentration of the enthesis in wild-type and Nlrp3−/− mice at 3, 7, 14, and 28 dpi. T, tendon; I, tendon-to-bone interface; B, bone. Data are presented as means ± SD. Statistical significance was determined using one-way analysis of variance (ANOVA) with Tukey’s multiple comparisons test. d, days.
Fig. 2.
Fig. 2.. The activation of NLRP3 inflammasomes inhibits enthesis regeneration.
(A) Schematic of animal experiments, in which the enthesis injury and the repair model were established in wild-type and Nlrp3−/− mice, with analyses at 3, 7, 14, and 28 dpi. (B) H&E and toluidine blue staining of the enthesis in wild-type and Nlrp3−/− mice at 14 and 28 dpi. Black dashed squares represent enlarged images of the enthesis. (C and D) Metachromasia area size and histological scores of the enthesis in wild-type and Nlrp3−/− mice at 14 and 28 dpi. (E) Micro-CT coronal views of the humerus of wild-type and Nlrp3−/− mice at 14 and 28 dpi. Green dashed squares represent the area of the enthesis. (F to H) Quantitative analysis of BMD, BV/TV, and Tb.N of the enthesis. (I) Deformation and load curves of the enthesis in wild-type and Nlrp3−/− mice at 14 and 28 dpi. (J to L) Failure load, stiffness, and work of the enthesis in wild-type and Nlrp3−/− mice at 14 and 28 dpi. Data are presented as means ± SD. Statistical significance was determined using one-way ANOVA with Tukey’s multiple comparisons test and Student’s t test.
Fig. 3.
Fig. 3.. scRNA-seq uncovers that NLRP3 inflammasomes deteriorate inflammation and IL-1β inflammatory cross-talk.
(A) Schematic of scRNA-seq, in which the enthesis was harvested from wild-type controls and Nlrp3−/− mice at 7 dpi and processed for scRNA-seq. (B) UMAP plot of 56,217 cells from wild-type controls (n = 3) and Nlrp3−/− mice (n = 3). (C) Bar plot of the proportions of nine major cell clusters in the injured enthesis of wild-type controls and Nlrp3−/− mice at 7 dpi. (D) Violin plots of specific gene expressions in macrophages, mesenchymal cells, and neutrophils. (E) GO enrichment analysis of down-regulated genes in PIM and up-regulated genes in AIM in Nlrp3−/− mice. (F) Circle plot of the interactions of subsets of macrophages and mesenchymal cells. Edge line thickness suggests the interaction strength between different cell clusters. (G) NicheNet analysis of ligand-target regulatory potential between macrophages and mesenchymal stem cells. (H) Gene set cores of IL-1 signaling in different mesenchymal cell subsets in wild-type controls and Nlrp3−/− mice. Statistical significance was determined using Student’s t test. FACS, fluorescence-activated cell sorting; TGF-β, transforming growth factor–β.
Fig. 4.
Fig. 4.. Blocking IL-1β inflammatory cross-talk with neutralizing antibodies accelerates enthesis regeneration.
(A) Schematic of animal experiments, in which the RCTR model was established, and IL-1β neutralizing antibodies or control IgG was injected into the articular cavity, with analyses at 14 and 28 dpi. (B) H&E and toluidine blue staining of the enthesis in mice with IL-1β neutralizing antibodies or control IgG injection at 14 and 28 dpi. Black dashed squares represent the enlarged images of the enthesis. (C and D) Histological scores and metachromasia area size of the enthesis in mice with IL-1β neutralizing antibodies or control IgG injection at 14 and 28 dpi. (E) Micro-CT coronal views of the humerus in mice with IL-1β neutralizing antibodies or control IgG injection at 14 and 28 dpi. Green dashed squares represent the area of the enthesis. (F to H) Quantitative analysis of BMD, BV/TV, and Tb. N of the enthesis in mice with IL-1β neutralizing antibodies or control IgG injection and sham operation. (I) Deformation and load curves of the enthesis in mice with IL-1β neutralizing antibodies or control IgG injection at 14 and 28 dpi. (J to L) Failure load, stiffness, and work of the enthesis in mice with IL-1β neutralizing antibodies or control IgG injection at 14 and 28 dpi. Data are presented as means ± SD. Statistical significance was determined using one-way ANOVA with Tukey’s multiple comparisons test and Student’s t test.
Fig. 5.
Fig. 5.. NLRP3 inflammasomes suppress the secretion of anti-inflammatory cytokines by macrophages to inhibit inflammation resolution.
(A) IL-1β concentration in the supernatant of wild-type and Nlrp3−/− BMDMs. (B) Scan images of the supernatant of wild-type and Nlrp3−/− BMDMs in the mouse inflammation array Q1. (C) Heatmap of inflammation factors in the supernatant of wild-type and Nlrp3−/− BMDMs. (D) Concentrations of IL-1β, IFN-γ, IL-6, TNF-α, IL-1α, IL-10, IL-13, and IL-4 in the supernatant of wild-type and Nlrp3−/− BMDMs. (E to H) IHC staining and ELISA analysis of IL-10 and IL-13 in the enthesis of wild-type and Nlrp3−/− mice. Green dashed squares represent the enlarged images of the enthesis. (I and J) Immunofluorescence staining and quantification of CD68 (green)– and CD206 (red)–positive cells in the enthesis of wild-type controls and Nlrp3−/− mice. Red dashed squares represent the enlarged images of the enthesis. Arrows indicate CD68+ and CD206+ macrophages. Data are presented as means ± SD. Statistical significance was determined using one-way ANOVA with Tukey’s multiple comparisons test and Student’s t test.
Fig. 6.
Fig. 6.. NLRP3 inflammasomes inhibit the production of docosatrienoic acid.
(A) Schematic of untargeted metabolomics of EIF. (B) PCA of untargeted metabolomics of EIF. (C) The number of differential metabolites in EIF. (D) Schematic of untargeted metabolomics and RNA sequencing of wild-type and Nlrp3−/− BMDMs. (E) PCA of untargeted metabolomics of supernatant from wild-type and Nlrp3−/− BMDMs. (F) The number of differential metabolites in the supernatant. (G) Venn diagram showing significantly enriched metabolites in different experimental setting. (H and I) Mass spectrometer quantification of DTA in EIF and supernatant. (J) PCA of RNA sequencing of wild-type and Nlrp3−/− BMDMs. (K) GO enrichment analysis of differentially expressed pathways of BMDMs. (L) Gene set enrichment analysis (GSEA) of biosynthesis of unsaturated fatty acids. (M) Gene set cores of unsaturated fatty acid biosynthetic process and regulation of unsaturated fatty acid biosynthetic process in PIM and AIM in wild-type controls and Nlrp3−/− mice. Statistical significance was determined using one-way ANOVA with Tukey’s multiple comparisons test and Student’s t test.
Fig. 7.
Fig. 7.. Docosatrienoic acid boosts cell proliferation and enthesis regeneration.
(A) GO enrichment analysis of differentially expressed pathways of BMSCs. (B) GSEA of phosphatidylinositol signaling. NES, normalized enrichment score. (C) EdU (red) and nucleus (blue) staining of BMSCs with or without DTA treatment. (D) Schematic of animal experiments, in which DTA was replenished at 3 and 7 dpi. (E) H&E and toluidine blue staining of the enthesis in mice with DTA supplement or saline injection at 14 and 28 dpi. Black dashed squares represent the enlarged images of the enthesis. (F and G) Histological scores and metachromasia area size of the enthesis in mice with DTA supplement or saline injection at 14 and 28 dpi. (H) Micro-CT coronal views of the humerus of mice with DTA supplement or saline injection at 14 and 28 dpi. Green dashed squares represent the area of the enthesis. (I to K) Quantitative analysis of BMD, BV/TV, and Tb.N of the enthesis. (L) Deformation and load curves of the enthesis in mice with DTA supplement or saline injection at 14 and 28 dpi. (M to O) Failure load, stiffness, and work of the enthesis in mice with DTA supplement or saline injection at 14 and 28 dpi. Data are presented as means ± SD. Statistical significance was determined using one-way ANOVA with Tukey’s multiple comparisons test and Student’s t test.
Fig. 8.
Fig. 8.. Conditional KO of P2rx7 in myeloid cells reduces NLRP3 inflammasome activation after enthesis injury and improves enthesis regeneration.
(A) Immunofluorescence staining of CD68 (green) and P2X7R (yellow) in native and injured enthesis. Red dashed squares represent enlarged images of the enthesis. (B) Feature plots of single-cell gene expression of P2rx7 in macrophages in wild-type mice. (C and D) The relative caspase-1 activity and concentration of IL-1β in the enthesis of Lyz2-P2rx7f/f and Lyz2-P2rx7−/− mice at 3, 7, 14, and 28 dpi. (E) Schematic of animal experiments, in which the RCTR model was established in Lyz2-P2rx7f/f and Lyz2-P2rx7−/− mice, and analyzed at 3, 7, 14, and 28 dpi. (F) H&E and toluidine blue staining of the enthesis in Lyz2-P2rx7f/f and Lyz2-P2rx7−/− mice at 14 and 28 dpi. Black dashed squares represent enlarged images of the enthesis. (G and H) Histological scores and the metachromasia area size of the enthesis in Lyz2-P2rx7f/f and Lyz2-P2rx7−/− mice at 14 and 28 dpi. (I) Micro-CT coronal views of the humerus of Lyz2-P2rx7f/f and Lyz2-P2rx7−/− mice at 14 and 28 dpi. Green dashed squares represent the area of interest. (J and K) Quantitative analysis of the BMD and BV/TV of the enthesis. (L) Deformation and load curves of the enthesis in Lyz2-P2rx7 f/f and Lyz2-P2rx7−/− mice at 14 and 28 dpi. (M to O) Failure load, stiffness, and work of the enthesis in mice with IL-1β neutralizing antibodies or control IgG injection at 14 and 28 dpi. Data are presented as means ± SD. Statistical significance was determined using one-way ANOVA with Tukey’s multiple comparisons test and Student’s t test.
Fig. 9.
Fig. 9.. The schematic of this study.
After enthesis injury, NLRP3 inflammasomes are activated in infiltrated macrophages upon receiving activation signals mediated by P2X7R. The activation of the P2X7R/NLRP3 inflammasome axis not only exacerbates inflammation by prompting the release of IL-1β and suppressing the production of anti-inflammatory factors including IL-10 and IL-13 but also inhibits the production of proregenerative docosatrienoic acid. NLRP3 inflammasomes suppress enthesis regeneration via aggravating IL-1β inflammatory cross-talk and restraining docosatrienoic acid metabolic cross-talk between macrophages and stem cells. Blocking the P2X7R/NLRP3 inflammasome axis rewires the cross-talk between macrophages and stem cells and converts pathological inflammation to reparative inflammation. This study illustrates that the P2X7R/NLRP3 inflammasome axis is a promising regenerative therapeutic target for enthesis injury treatment.

Similar articles

Cited by

References

    1. Lu H. H., Thomopoulos S., Functional attachment of soft tissues to bone: Development, healing, and tissue engineering. Annu. Rev. Biomed. Eng. 15, 201–226 (2013). - PMC - PubMed
    1. Wang X., Lin J., Li Z., Ma Y., Zhang X., He Q., Wu Q., Yan Y., Wei W., Yao X., Li C., Li W., Xie S., Hu Y., Zhang S., Hong Y., Li X., Chen W., Duan W., Ouyang H., Identification of an ultrathin osteochondral interface tissue with specific nanostructure at the human knee joint. Nano Lett. 22, 2309–2319 (2022). - PubMed
    1. Genin G. M., Thomopoulos S., The tendon-to-bone attachment: Unification through disarray. Nat. Mater. 16, 607–608 (2017). - PMC - PubMed
    1. Rossetti L., Kuntz L. A., Kunold E., Schock J., Muller K. W., Grabmayr H., Stolberg-Stolberg J., Pfeiffer F., Sieber S. A., Burgkart R., Bausch A. R., The microstructure and micromechanics of the tendon-bone insertion. Nat. Mater. 16, 664–670 (2017). - PubMed
    1. Atesok K., Fu F. H., Wolf M. R., Ochi M., Jazrawi L. M., Doral M. N., Lubowitz J. H., Rodeo S. A., Augmentation of tendon-to-bone healing. J. Bone Joint Surg. Am. 96, 513–521 (2014). - PubMed