. 2025;19(9):101523.
doi: 10.1016/j.jcmgh.2025.101523. Epub 2025 Apr 24.

The Role of the Hexosamine-Sialic Acid Metabolic Pathway Mediated by GFPT1/NANS in c-Myc-Driven Hepatocellular Carcinoma

Affiliations

The Role of the Hexosamine-Sialic Acid Metabolic Pathway Mediated by GFPT1/NANS in c-Myc-Driven Hepatocellular Carcinoma

Shiguan Wang et al. Cell Mol Gastroenterol Hepatol. 2025.

Abstract

Background & aims: Hepatocellular carcinoma (HCC) frequently involves metabolic reprogramming, which promotes oncogenesis and metastasis. However, the underlying molecular mechanisms remain insufficiently explored. In this study, we aim to investigate the metabolic abnormalities in c-Myc-driven HCC development and their potential therapeutic implications.

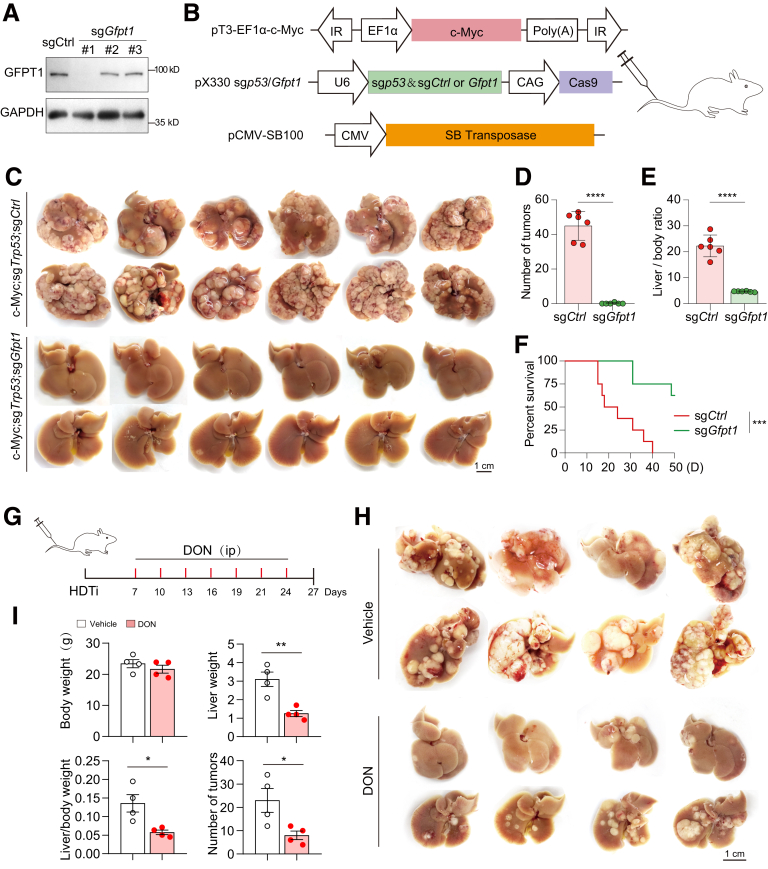
Methods: RNA sequencing and metabolomics were performed on HCC and adjacent tissues in a murine HCC model established by hydrodynamic tail-vein injection of c-Myc and sgTrp53/Cas9 plasmids. Key catalytic enzyme gene knockout was used to assess tumor formation and murine survival. Gene expression was analyzed using quantitative polymerase chain reaction, immunohistochemistry, and Western blot. Chromatin immunoprecipitation followed by quantitative polymerase chain reaction and luciferase assays verified c-Myc regulation.

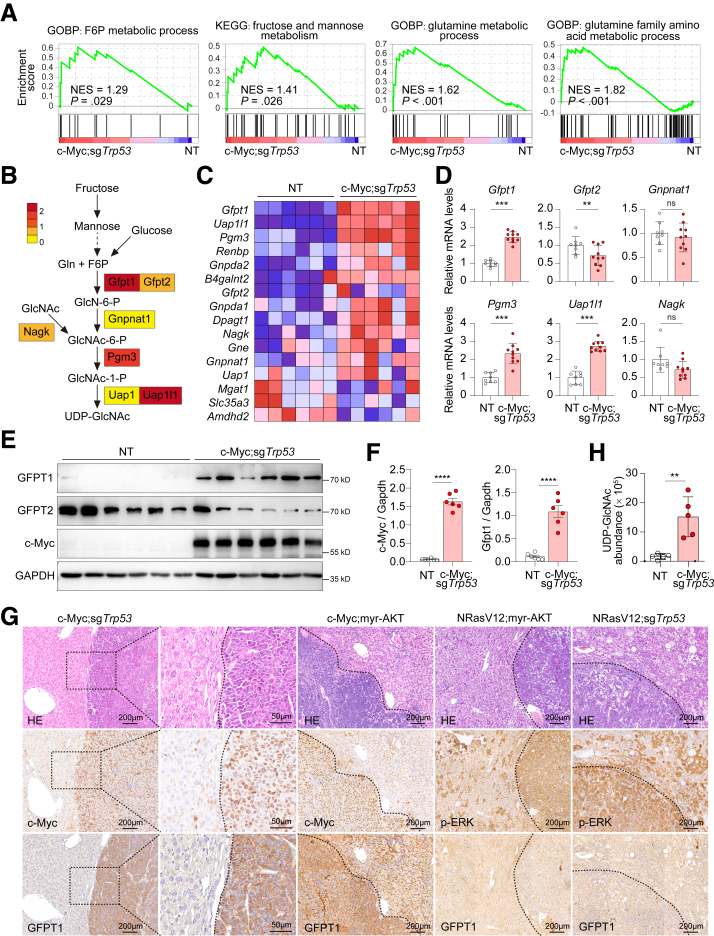
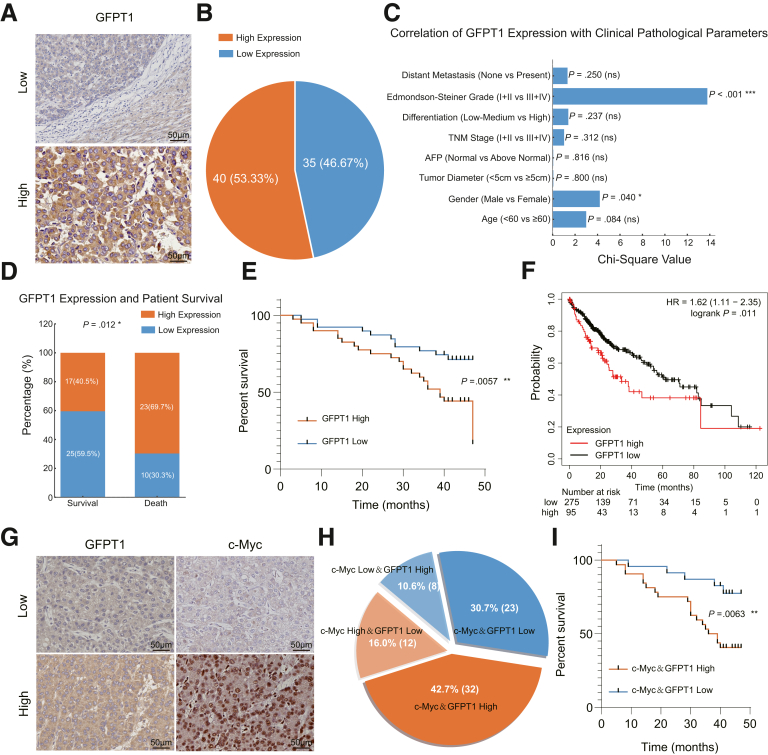
Results: RNA sequencing data revealed that the hexosamine biosynthetic pathway was significantly activated in c-Myc-driven HCC. The rate-limiting enzyme GFPT1 (rather than GFPT2) was up-regulated in the first step of this pathway. Knocking out GFPT1 reduces tumor growth and prolongs murine survival. Human specimens showed that GFPT1 was overexpressed in HCC tissues and was associated with advanced Edmondson-Steiner grades and short patient survival. Further luciferase reporter assays confirmed that c-Myc binds directly to the promoter region of GFPT1 and activates its transcription. Subsequent examination of the downstream pathways of the hexosamine biosynthetic pathway showed that the sialic acid synthesis (but not O-GlcNac glycosylation) pathway was enhanced, which was mediated by a key enzyme, N-acetylneuraminic acid synthase. Knockout of N-acetylneuraminic acid synthase also inhibits tumor growth and extends murine survival in c-Myc-driven HCC models.

Conclusions: These findings indicate that the activation of the hexosamine biosynthetic pathway/sialic acid pathway is an important mechanism underlying the development of c-Myc-driven HCC. Inhibitors of GFPT1, along with anti- N-acetylneuraminic acid synthase may offer a promising therapeutic strategy.

Keywords: GFPT1; Hepatocellular Carcinoma; Hexosamine Biosynthetic Pathway; Metabolic Reprogramming; NANS; Sialic Acid Synthesis.


Figures

Figure 1
Figure 1
Aberrant metabolism in Trp53KO/c-MycOE-induced HCC. (A) Enrichment of the HBP substrates in Trp53KO/c-MycOE-induced HCC tissues. (B) Schematic representation of enzymatic steps in the HBP pathway. (C) The heatmap showing the expression levels of key HBP enzymes in HCC tissues. (D) RT-qPCR validation of mRNA expression differences for key HBP enzymes. (E) Western blot analysis of c-Myc, GFPT1, and GFPT2 protein levels in HCCs and adjacent noncancerous tissues. (F) Quantification of Western blot results. (G) Immunohistochemistry analysis of c-Myc, GFPT1, and p-ERK expression in different orthotopic HCC models. (H) Differences in UDP-GlcNAc content between HCC and adjacent normal tissues. Data shown as mean ± standard deviation; ns, not significant. ∗∗P < .01, ∗∗∗P < .001, ∗∗∗∗P < .0001 by unpaired 2-tailed Student t test.
Figure 2
Figure 2
Analysis of GFPT1 expression and its clinical correlation in human primary HCC. (A) Immunohistochemistry analysis of GFPT1 expression in patients with HCC. (B) Grouping of the 75 patients with HCC in the study based on GFPT1 IHC scores. (C) Correlation of GFPT1 expression with clinical pathologic parameters. (D) Stacked bar chart of GFPT1 expression and patient survival levels in a sample of 75 patients. (E) Survival curves for patients with high versus low GFPT1 expression. (F) Analysis of GFPT1 expression in HCC and its impact on patient prognosis using the Kaplan-Meier Plotter database. (G) IHC of GFPT1 and c-Myc in patients with HCC. (H) Grouping of the 75 patients with HCC based on GFPT1 and c-Myc IHC results. (I) Prognostic survival outcomes for patients with concurrent high or low expression of c-Myc and GFPT1. HR, hazard ratio.
Figure 3
Figure 3
c-Myc mediates transcriptional activation of GFPT1 through direct binding to its promoter in human and mouse. (A) c-Myc-binding peaks were visualized using IGV software in human HepG2 cells. (B) c-Myc binding peaks were visualized using IGV software in mouse MEL and CH12.LX cells. (C) ChIP-qPCR validation of c-Myc binding to the GFPT1 promoter in 293T cells (n = 3 biologic replicates). (D) ChIP-qPCR validation of c-Myc binding to the Gfpt1 promoter in AML12 cells (n = 3 biologic replicates). (E, F) Luciferase reporter assays in 293T cells transfected with pGL3 luciferase reporter plasmids containing the human (E) and mouse (F) GFPT1 promoter region (-2000 to -1 bp) or a variant lacking the c-Myc binding motif (n = 4 biologic replicates). Data shown as mean ± standard deviation; ∗P < .05, ∗∗P < .01, ∗∗∗∗P < .0001 by unpaired 2-tailed Student t test.
Figure 4
Figure 4
GFPT1 dependency in Trp53KO/c-MycOE-induced hepatocellular carcinoma. (A) Western blot analysis showing the knockout efficiency of sgGfpt1. (B) Schematic diagram of liver cancer induction via tail vein injection of pT3-EF1α-c-Myc; pX330 sgp53 & sgCtrl/sgGfpt1 and pCMV-SB100. (C) Representative macroscopic images of the liver at the experimental end point. (D) Number of liver tumors in mice from the pT3-EF1α-c-Myc; pX330 sgp53 & sgCtrl or sgGfpt1 groups. (E) Ratio of liver weight to body weight in mice from the pT3-EF1α-c-Myc; pX330 sgp53 & sgCtrl or sgGfpt1 groups. (F) Survival time of mice in the sgCtrl and sg Gfpt1 groups. (G) Treatment regimen for DON administration. (H) Representative macroscopic images of the liver at the experimental end point following DON treatment. (I) Body weight, tumor number, liver weight, and liver-to-body weight ratio in DON-treated and control mice. Data are presented as mean ± standard deviation; ns, not significant; ∗P < .05, ∗∗P < .01, ∗∗∗∗P < .0001 by unpaired 2-tailed Student t test.
Figure 5
Figure 5
Elevated expression of the Nans gene in the sialic acid synthesis pathway in c-Myc-induced HBP metabolic dysregulation in HCC. (A) Diagram of the downstream O-GlcNAcylation and sialic acid synthesis pathways in HBP. (B) The heatmap showing the expression levels of key genes in O-GlcNAc modification and sialic acid synthesis pathways. (C) RT-qPCR analysis of mRNA expression differences for key enzymes downstream of HBP. (D) Western blot analysis of NANS, OGT, and O-GlcNAc protein levels in HCCs and adjacent noncancerous tissues. (E) Quantification of the Western blot results from D. (F) Immunohistochemistry analysis of NANS expression in patients with HCC. (G) Grouping of 75 patients with HCC based on the expression levels of c-Myc, NANS, and GFPT1 and NANS. (H) Correlation analysis of c-Myc, GFPT1, and NANS mRNA expression in LIHC TCGA datasets using GEPIA2. Data shown as mean ± standard deviation; ns, not significant. ∗∗P < .01, ∗∗∗∗P < .0001 by unpaired 2-tailed Student t test.
Figure 6
Figure 6
NANS knockout modulates sialic acid synthesis, affecting tumor progression and survival in c-Myc-induced HCC. (A) Western blot analysis showing the knockout efficiency of sgOgt and sgNans. (B) Survival time of mice in the sgCtrl, sgOgt, and sgNans groups. (C) Representative macroscopic images of the liver at the experimental end point. (D) Number of liver tumors in mice from the pT3-EF1α-c-Myc; pX330 sgp53 & sgCtrl or sgNans groups. (E) Ratio of liver weight to body weight in mice from the pT3-EF1α-c-Myc; pX330 sgp53 & sgCtrl or sgNans groups. Data shown as mean ± standard deviation; ns, not significant. ∗P < .05, ∗∗∗P < .001, ∗∗∗∗P < .0001 by unpaired 2-tailed Student t test.

Similar articles

References

    1. Bray F., Ferlay J., Soerjomataram I., et al. Global cancer statistics 2018: GLOBOCAN estimates of incidence and mortality worldwide for 36 cancers in 185 countries. CA Cancer J Clin. 2018;68:394–424. - PubMed
    1. Yang J.D., Hainaut P., Gores G.J., et al. A global view of hepatocellular carcinoma: trends, risk, prevention and management. Nat Rev Gastroenterol Hepatol. 2019;16:589–604. - PMC - PubMed
    1. El-Serag H.B. Epidemiology of viral hepatitis and hepatocellular carcinoma. Gastroenterolgy. 2012;142:1264–1273.e1. - PMC - PubMed
    1. Wang H., Lin F., Xu Z., et al. ZEB1 transcriptionally activates PHGDH to facilitate carcinogenesis and progression of HCC. Cell Mol Gastroenterol Hepatol. 2023;16:541–556. - PMC - PubMed
    1. Dang C.V. MYC on the path to cancer. Cell. 2012;149:22–35. - PMC - PubMed

MeSH terms

Substances