. 2025 Jun;301(6):108536.
doi: 10.1016/j.jbc.2025.108536. Epub 2025 Apr 23.

In situ detection of activation of CAPN3, a responsible gene product for LGMDR1, in mouse skeletal myotubes

Affiliations

In situ detection of activation of CAPN3, a responsible gene product for LGMDR1, in mouse skeletal myotubes

Chihiro Hisatsune et al. J Biol Chem. 2025 Jun.

Abstract

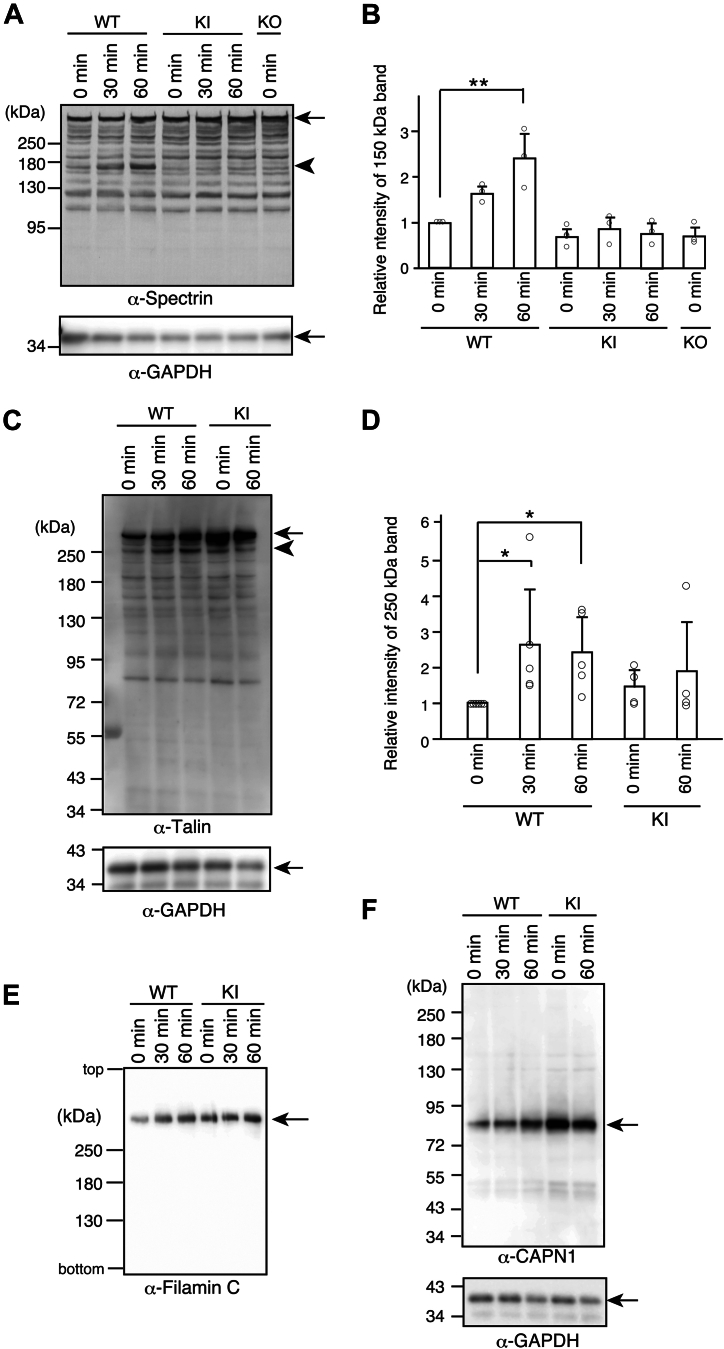
CAPN3/calpain-3/p94, a muscle-specific Ca2+-dependent cysteine protease, is responsible for limb-girdle muscular dystrophy R1 (LGMDR1), an autosomal recessive muscular dystrophy. However, the activation mechanism and physiological function of CAPN3 in skeletal muscles remain unknown. Here, we capture the in situ activation of CAPN3 in cultured mouse skeletal myotubes. Using our newly developed antibody, which specifically recognizes CAPN3 autolytic processing, we succeeded in differentiating WT CAPN3 from a protease-inactive CAPN3 mutant by immunostaining. We further demonstrated that CAPN3 predominantly localized at the M-bands of cultured skeletal myotubes at rest and translocated to the cytoplasm after activation by stimulation with ouabain, a cardiotonic steroid. This event requires a small but long-lasting cytoplasmic increase in Ca2+ levels, which is sufficient for the activation of CAPN3 but not of calpain-1/CAPN1. Activated CAPN3 digests the cytoskeletal proteins spectrin and talin. Thus, we successfully visualized the intracellular dynamics of endogenous CAPN3 in cultured skeletal muscles after activation by ouabain and demonstrated the subsequent processing of endogenous substrates in living cells. Our study will help understand the physiological functions of CAPN3 in skeletal muscles and the pathophysiological mechanisms of limb-girdle muscular dystrophy R1.

Keywords: calcium; calpain; muscular dystrophy; protein translocation; skeletal muscle.


Conflict of interest statement

Conflict of interest The authors declare that they have no conflicts of interest with the contents of this article.

Figures

Figure 1
Figure 1
Production of an antibody recognizing an autoprocessing site within the IS1 region of human CAPN3. A, schematic illustration showing autoprocessing of CAPN3 and a synthesized peptide used for rabbit immunization. CBSW, calpain-type β-sandwich. IS, internal sequence. NS, N-terminal sequence. PC, protease core. PEF, penta EF motif. C129, H334, and N358 are catalytic centers. One, two, and three indicate the cleavage sites within the IS1 region. The bar indicates the antigen region (488–666 amino acids encoded by BC146672) of a commercial polyclonal anti-CAPN3 antibody (Proteintech, 284SS76-1-AP). B, immunostaining of HEK293T cells transiently expressing EGFP-CAPN3 or CAPN3:C129S (CS) with anti-AIS1 (magenta). EGFP (green). DAPI (blue). C, western blot of the cell lysates of HEK293T cells transiently expressing EGFP-CAPN3 and CAPN3:CS with anti-CAPN3 (upper panel) and anti-AIS1 (lower panel) antibody. An arrow shows the full-length of EGFP-CAPN3CS (130 kDa), and an arrowhead indicates the 58 kDa autocleaved fragment of EGFP-CAPN3. The 130 kDa band of the full-length of EGFP-CAPN3 is faint, because of rapid autolysis. D, schematic illustration of autolytic fragments and the recognition site of anti-AIS1 antibody. The two fragments (a and b) recognized by the anti-AIS1 antibody are approximately 30 kDa. AIS1, autolytic site within IS1; DAPI, 4′,6-diamidino-2-phenylindole; CAPN3, calpain 3.
Figure 2
Figure 2
Analysis of autolytic activity of LGMDR1 mutants by anti-AIS1 antibody. A, immunostaining of COS-7 cells expressing WT CAPN3 and its mutants with CF488-conjugated anti-AIS1 (green) and CF555-conjugated anti-CAPN3 (red) antibody. The scale bar represents 20 μm. B, scatter plot of CAPN3 versus AIS1 intensities of WT CAPN3 and its mutants. C, mean ratio of AIS1 to CAPN3 intensity of WT and its mutants. N = 5 ∼ 14 cells. Each plot represents an individual cell value. Mean ± SD. ∗∗∗p < 0.001, one-way ANOVA with Dunnett’s multiple comparison test. AIS1, autolytic site within IS1; CAPN3, calpain 3.
Figure 3
Figure 3
Ouabain Ca2+ dependently activates CAPN3:S606L in HeLa cells. A, immunostaining of HeLa cells transiently expressing CAPN3:S606L with anti-AIS1 (green) and anti-CAPN3 (magenta) antibody upon 1 mM ouabain stimulation. The scale bar represents 10 μm. B, change in cytosolic AIS1/CAPN3 immuno-intensity ratio of CAPN3:S606L-expressing cells after ouabain stimulation. Mean ± SD. Number of cells examined are 43, 23, and 52 for 0, 30, and 60 min, respectively. ∗∗∗p < 0.001, one-way ANOVA with Bonferroni’s test for multiple comparison. C, Ca2+ imaging of HeLa cells without BSS or with ouabain (1 mM) stimulation with a Ca2+ indicator, Fura 2. Ratio change of Fura 2 (340 nm/380 nm) is indicated. As a reference, Ca2+ signals of HeLa cells upon 10 μM ATP stimulation are also indicated. D, ratio change of Fura 2 (340 nm/380 nm) between 0 and 30 min with or without 1 mM ouabain stimulation. Mean ± SD. ∗∗∗p = 2.45 x 10⁻⁹, Two tailed student’s unpaired t test. As a reference, peak amplitude of the ratio changes of Fura 2 upon 10 μM ATP stimulation is also included in the figure. N = 123, 103, and 72 cells for BSS, ouabain, and ATP, respectively. E, pretreatment with a Ca2+ chelator BAPTA-AM (25 μM) inhibits the ouabain-induced autolysis of CAPN3:S606L in HeLa cells. The same membrane was probed with antibodies for CAPN3, AIS1, and β−actin. In the CAPN3 panel, an arrow shows the full-length of CAPN3:S606L (94 kDa), and an arrowhead indicates the autocleaved 58 kDa fragment of CAPN3:S606L. F, increase in the AIS1 band intensity of CAPN3:S606L after ouabain stimulation and its inhibition by BAPTA-AM treatment. The experiments were performed 8, 6, 8, and 4 times for each bar, respectively. Mean ± SD. ∗∗p = 0.01445, ∗∗∗p = 0.0037, Steel-Dwass test. AIS1, autolytic site within IS1; CAPN3, calpain 3.
Figure 4
Figure 4
Ouabain increases the autolysis of endogenous CAPN3 in mouse-cultured skeletal muscles. A, autolysis of CAPN3 in cultured skeletal muscles (day 7 in vitro after differentiation) from WT, inactive-form knock-in (KI), and KO mice. The same membrane was probed with antibodies for CAPN3, AIS1, and GAPDH. In the upper CAPN3 panel, an arrow shows the full-length of CAPN3 (94 kDa) and an arrowhead indicates autocleaved 58 kDa fragment of CAPN3. B, changes in the relative band intensity of 94 kDa, 58 kDa, and 30 kDa in A. Mean ± SD. N = 3∼4. ∗p < 0.05, ∗∗∗p < 0.001, one-way ANOVA with Dunnett’s multiple comparison test. C, validation of the specificity of the anti-CAPN3 (Proteintech, 28476-1-AP) antibody on cultured CAPN3 KO skeletal myotubes. Green: CAPN3; magenta: Actinin (Z-band). The scale bar represents 10 μm. D, intensity profiles of CAPN3 and actinin signals on white bars (2 μm thick) in the panels of C. Upper panel: WT myotubes; lower panel: KO myotubes. Arrows indicate CAPN3 immunosignals at the M-bands. E, immunohistochemistry of EDLs from WT and CAPN3 KO mice with anti-CPAN3 (green) and anti-actinin (magenta, Z-band) antibody. The scale bar represents 20 μm. F, intensity profiles of CAPN3 and actinin signals on white bars (2 μm thick) in the left panel E. Upper panel: WT EDL; lower panel: KO EDL. Arrows indicate CAPN3 immunosignals at the M-bands. AIS1, autolytic site within IS1; CAPN3, calpain 3; EDL, extensor digitorum longus.
Figure 5
Figure 5
Translocation of WT but not inactive-form of CAPN3 from the M-bands into the cytosol in cultured skeletal muscles after ouabain stimulation. A and B, immunostaining of AIS1 and CAPN3 in cultured skeletal muscles from WT, KI, and KO mice before (A) and aftr 1 mM ouabain stimulation for 60 min (B). AIS1 (green), CAPN3 (magenta), and DAPI (blue). The squares show the magnified areas from the images. Arrows show faint striatal patterns of AIS1 signals in ouabain-treated WT myotubes. The scale bar represents 10 μm. C, ouabain-induced cytosolic Ca2+ levels in WT skeletal myotubes. Fura 2 ratio (340 nm/380 nm) for 60 min was plotted. D, time-dependent increase of Fura 2 ratio (340 nm/380 nm) following 1 mM ouabain stimulation. Mean ± SD. Number of cells analyzed were 28. ∗p = 0.0229, one-way ANOVA with Dunnett’s multiple comparison test. AIS1, autolytic site within IS1; CAPN3, calpain 3; DAPI, 4′,6-diamidino-2-phenylindole.
Figure 6
Figure 6
Immunostaining of titin before and after ouabain stimulation. Immunostaining of titin (TTN9, N2A, green) and titin (9D10, M-bands, magenta) in cultured skeletal muscles from WT and KI mice before and after stimulation with 1 mM ouabain for 60 min. Phalloidin: yellow. The lower panels show magnified images of the square area in the upper images. The scale bar represents 10 μm.
Figure 7
Figure 7
Digestion of spectrin and talin by activated CAPN3 in cultured skeletal muscles upon ouabain stimulation. A, time-dependent increase in the spectrin fragment (∼150 kDa) of cultured skeletal muscles from WT, but not KI and KO mice upon 1 mM ouabain stimulation. Upper arrow indicates the full-length of spectrin, whereas lower arrowhead indicates the cleaved 150 kDa fragment (upper panel). The same membrane was probed with antibodies for GAPDH (lower panel). B, relative band intensities of the 150 kDa spectrin fragments in (A). Mean ± SD. Number of experiments were 3 ∼ 4. ∗∗p < 0.01, one-way ANOVA with Dunnett’s multiple comparison test. C, time-dependent cleavage of talin in WT myotubes by ouabain. The same membrane was probed with antibodies for talin (upper panel) and GAPDH (lower panel). The upper arrow shows full length of talin and the lower arrowhead indicates the cleaved talin. D, relative intensity of the cleaved band (∼250 kDa) of talin. Mean ± SD. Number of experiments were 4 ∼ 6. ∗p < 0.05, Steel-Dwass test. E, expression of Filamin C in the cell lysates of ouabain-treated WT and KI myotubes. Samples were electrophoresed on a 6.0% SDS-PAGE and continued running for an additional 60 min after the dye front reached the bottom of the gels, as previously reported (59). Top and bottom indicated the top and bottom of the gel, respectively. F, immunoblot of CAPN1 in the cell lysates of ouabain-treated WT and KI myotubes. Autolysis of CAPN1 was not observed in ouabain-treated myotubes. The same membrane was probed with antibody against GAPDH (lower panel). The experiments were performed three times. CAPN3, calpain 3.

Similar articles

References

    1. Richard I., Broux O., Allamand V., Fougerousse F., Chiannilkulchai N., Bourg N., et al. Mutations in the proteolytic enzyme calpain 3 cause limb-girdle muscular dystrophy type 2A. Cell. 1995;81:27–40. - PubMed
    1. Sorimachi H., Imajoh-Ohmi S., Emori Y., Kawasaki H., Ohno S., Minami Y., et al. Molecular cloning of a novel mammalian calcium-dependent protease distinct from both m- and μ-types. J. Biol. Chem. 1989;264:20106–20111. - PubMed
    1. Ohno S., Emori Y., Imajoh S., Kawasaki H., Kisaragi M., Suzuki K. Evolutionary origin of a calcium-dependent protease by fusion of genes for a thiol protease and a calcium-binding protein? Nature. 1984;312:566–570. - PubMed
    1. Emori Y., Kawasaki H., Sugihara H., Imajoh S., Kawashima S., Suzuki K. Isolation and sequence analyses of cDNA clones for the large subunits of two isozymes of rabbit calcium-dependent protease. J. Biol. Chem. 1986;261:9465–9471. - PubMed
    1. Campbell R.L., Davies P.L. Structure-function relationships in calpains. Biochem. J. 2012;447:335–351. - PubMed

LinkOut - more resources