. 2025 Apr 24;13(4):e010365.
doi: 10.1136/jitc-2024-010365.

Intratumoral microbiota predicts the response to neoadjuvant chemoimmunotherapy in triple-negative breast cancer

Affiliations

Intratumoral microbiota predicts the response to neoadjuvant chemoimmunotherapy in triple-negative breast cancer

Yilin Chen et al. J Immunother Cancer. .

Abstract

Background: Neoadjuvant immunotherapy combined with chemotherapy (Chemo-IM) is associated with significantly improved pathological complete response (pCR) rates and long-term survival outcomes in patient with early-stage triple-negative breast cancer (TNBC). However, only a small proportion of patients benefit from the addition of immunotherapy. Here, we explored and confirmed the role of intratumoral microbiota in screening patients with TNBC who are likely to benefit from neoadjuvant Chemo-IM.

Methods: Patients with previously untreated, non-metastatic TNBC receiving neoadjuvant Chemo-IM were enrolled. Differences in the intratumoral microbiota between the pCR and non-pCR groups were explored via 16S rDNA sequencing (16S-seq). Single-cell transcriptome sequencing (scRNA-seq) was employed to profile the tumor microenvironment (TME). Moreover, correlations between the intratumor microbiota and the TME were explored. Finally, machine-learning models based on the intratumoral microbiota were constructed to predict pCR.

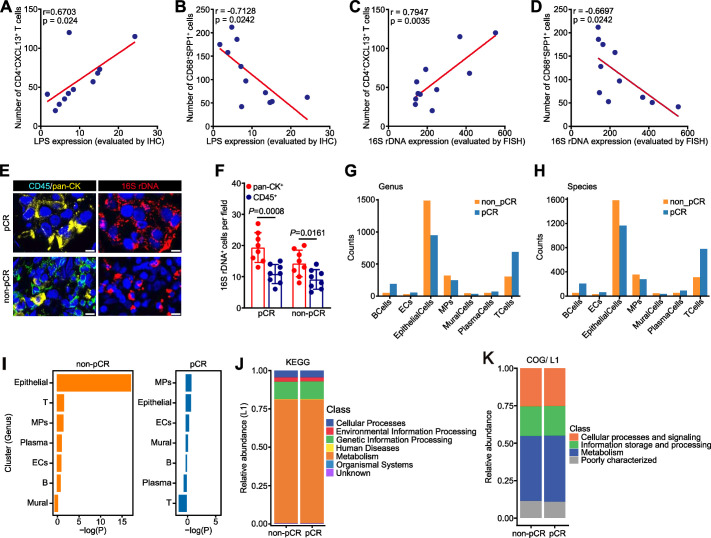
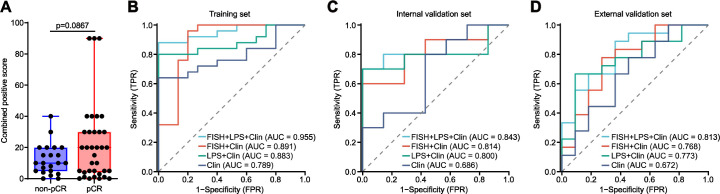
Results: A total of 89 female patients with early-stage TNBC treated by neoadjuvant Chemo-IM were enrolled. We found that the pCR group had greater diversity and a higher load of intratumoral microbiota than the non-pCR group. Intriguingly, scRNA-seq revealed significantly increased T cell infiltration and decreased tumor-associated macrophage infiltration into tumors in the pCR group. Moreover, intratumoral microbiota load was positively associated with CD4+CXCL13+ T cell infiltration and negatively associated with CD68+SPP1+ macrophage infiltration. Combined analysis of 16S-seq and scRNA-seq data revealed that intratumoral microbiota were present in both cancer and immune cells. Finally, we developed a model incorporating intratumoral microbiota and clinicopathological characteristics, and it showed strong power for predicting pCR to neoadjuvant Chemo-IM.

Conclusions: Intratumoral microbiota may serve as a strong and specific predictor of the response of patients with early-stage TNBC to neoadjuvant Chemo-IM. Our findings could contribute to the development of individualized Chemo-IM strategies for treating TNBC.

Keywords: Biomarker; Breast Cancer; Immunotherapy; Intratumoral.


Conflict of interest statement

Competing interests: No, there are no competing interests.

Figures

Figure 1
Figure 1. pCR tumors had higher intratumoral microbiota load. (A) Schematic phylogenetic tree depicting the representative bacterial genera of TNBC tissues based on 16S-seq and scRNA-seq data. Various colors and shades within the circles denote the classifications of bacteria at the order (inner circle) and phylum (middle circle) levels. (B) RT-qPCR analysis of intratumoral microbiota load of pCR and non-pCR tumors (n=10 in control, n=22 in non-pCR and n=35 in pCR groups). (C) Representative images of FISH staining of 16S rDNA in pCR and non-pCR tumors from the GDPH cohort. Scale bars, left panels, 400 µm; right panels, 40 µm. (D) Statistical quantification of 16S rDNA in pCR and non-pCR tumors from the GDPH cohort (n=23 in non-pCR and n=37 in pCR). (E) Representative images of IHC staining of LPS in pCR and non-pCR tumors from the GDPH cohort. Scale bars, left panels, 375 µm; right panels, 35 µm. (F) Statistical quantification of LPS in pCR and non-pCR tumors from the GDPH cohort (n=22 in non-pCR and n=37 in pCR). (G) Representative images of FISH staining of 16S rDNA in tumors from the FPHF cohort. Scale bars, left panels, 400 µm; right panels, 40 µm. (H) Statistical quantification of 16S rDNA in pCR and non-pCR tumors from the FPHF cohort (n=11 in non-pCR and n=18 in pCR). (I) Representative images of IHC staining of LPS in tumors from the FPHF cohort. Scale bars, left panels, 375 µm; right panels, 35 µm. (J) Statistical quantification of LPS in pCR and non-pCR tumors from the FPHF cohort (n=11 in non-pCR and n=18 in pCR). (K) Statistical quantification of 16S rDNA in tumors with radiology-defined CR and non-CR (n=20 in non-CR and n=40 in CR). (L) Statistical quantification of LPS in tumors with radiology-defined CR and non-CR (n=19 in non-CR and n=40 in CR). 16S-seq, 16S rDNA sequencing; CR, complete response; FISH, fluorescence in situ hybridization; FPHF, First People’s Hospital of Foshan; GDPH, Guangdong Provincial People’s Hospital; IHC, immunohistochemistry; pCR, pathological complete response; RT-qPCR, real-time quantitative PCR; ScRNA-seq, single-cell transcriptome sequencing.
Figure 2
Figure 2. scRNA-seq identified the distinctive tumor microenvironment of pCR and non-pCR tumors. (A) Workflow diagram of scRNA-seq of pCR and non-pCR tumors. (B) UMAP plots (left panel) and statistical histograms (right panel) of cells from seven samples, with each cell color coded to indicate the associated cell types. (C–H) UMAP plots (left panels) and statistical histograms (right panels) of subclusters of cancer and immune cells. (I) mIF staining of markers of CD4+CXCL13+ T cells and CD68+SPP1+ macrophages (n=6 in pCR and n=5 in non-pCR). (J) Statistical analysis of CD68+SPP1+ macrophages by flow cytometry assay (n=5 in pCR and n=3 in non-pCR). (K) Statistical analysis of CD4+CXCL13+ T cells by flow cytometry assay (n=5 in pCR and n=3 in non-pCR). cDC, classical dendritic cell; DAPI, 4′,6-diamidino-2-phenylindole; ECs, endothelial cells; FACS, Fluorescence-Activated Cell Sorting; mIF, multiplex immunofluorescence staining; MPs, mononuclear phagocytes; pCR, pathological complete response; pDC, plasmacytoid dendritic cell; ScRNA-seq, single-cell transcriptome sequencing; TNBC, triple-negative breast cancer; UMAP, Uniform Manifold Approximation and Projection.
Figure 3
Figure 3. Intratumoral microbiota was positively associated with activated TME. (A–B) Correlation analysis of LPS and CD4+CXCL13+ T cells and CD68+SPP1+ macrophages (n=11). (C–D) Correlation analysis of 16S rDNA and CD4+CXCL13+ T cells and CD68+SPP1+ macrophages (n=11). (E) Colocalization analysis of 16S rDNA in cancer (pan-CK) and immune (CD45) cells by FISH and mIF. Scale bars, 20 µm. (F) Statistical analysis of pan-CK+16S rDNA+ and CD45+16S rDNA+ cells in pCR and non-pCR tumors (n=8). (G–H) Histograms of bacterial gene fragments detected in different cell types. (I) Bar plots showing the adjusted Wilcoxon p value comparing the transcriptional diversity of bacterium-associated cells with unassociated cells for each cell type. (J) KEGG pathway enrichment analysis of 16S-seq data in pCR and non-pCR tumors. (K) COG pathway enrichment analysis of 16S-seq data in pCR and non-pCR tumors. COG, Clusters of Orthologous Groups; ECs, endothelial cells; FISH, fluorescence in situ hybridization; IHC, immunohistochemistry; KEGG, Kyoto Encyclopedia of Genes and Genomes; LPS, Lipopolysaccharide; mIF, multiplex immunofluorescence staining; MPs, mononuclear phagocytes; pCR, pathological complete response; TME, tumor microenvironment.
Figure 4
Figure 4. Intratumoral microbiota predicts tumor response to neoadjuvant Chemo-IM in early-stage TNBC. (A) CPS of pCR and non-pCR tumors (n=22 in non-pCR and n=35 in pCR). (B–D) ROCs of different predictive models with or without intratumoral microbiota in training (B), internal validation (C) and external validation sets (D). The clinical model was constructed using the factors including age, pathological grade, tumor stage, Ki67 expression and CPS. AUC, area under curve; Chemo-IM, chemotherapy combined with immunotherapy; CPS, combined positive score; FISH, fluorescence in situ hybridization; FRP, False Positive Rate; LPS, Lipopolysaccharide; pCR, pathological complete response; ROCs, receiver operating curves; TNBC, triple-negative breast cancer; TRP, True Positive Rate.

References

    1. Waks AG, Winer EP. Breast Cancer Treatment: A Review. JAMA. 2019;321:288–300. doi: 10.1001/jama.2018.19323. - DOI - PubMed
    1. Leon-Ferre RA, Goetz MP. Advances in systemic therapies for triple negative breast cancer. BMJ. 2023;381:e071674. doi: 10.1136/bmj-2022-071674. - DOI - PubMed
    1. Denkert C, Liedtke C, Tutt A, et al. Molecular alterations in triple-negative breast cancer-the road to new treatment strategies. Lancet. 2017;389:2430–42. doi: 10.1016/S0140-6736(16)32454-0. - DOI - PubMed
    1. Adams S, Gatti-Mays ME, Kalinsky K, et al. Current Landscape of Immunotherapy in Breast Cancer: A Review. JAMA Oncol. 2019;5:1205–14. doi: 10.1001/jamaoncol.2018.7147. - DOI - PMC - PubMed
    1. Broglio KR, Quintana M, Foster M, et al. Association of Pathologic Complete Response to Neoadjuvant Therapy in HER2-Positive Breast Cancer With Long-Term Outcomes: A Meta-Analysis. JAMA Oncol. 2016;2:751–60. doi: 10.1001/jamaoncol.2015.6113. - DOI - PubMed

LinkOut - more resources