. 2025 Apr 25;16(1):3923.
doi: 10.1038/s41467-025-58954-5.

A suppression-modification gene drive for malaria control targeting the ultra-conserved RNA gene mir-184

Affiliations

A suppression-modification gene drive for malaria control targeting the ultra-conserved RNA gene mir-184

Sebald A N Verkuijl et al. Nat Commun. .

Abstract

Gene drive technology presents a promising approach to controlling malaria vector populations. Suppression drives are intended to disrupt essential mosquito genes whereas modification drives aim to reduce the individual vectorial capacity of mosquitoes. Here we present a highly efficient homing gene drive in the African malaria vector Anopheles gambiae that targets the microRNA gene mir-184 and combines suppression with modification. Homozygous gene drive (miR-184D) individuals incur significant fitness costs, including high mortality following a blood meal, that curtail their propensity for malaria transmission. We attribute this to a role of miR-184 in regulating solute transport in the mosquito gut. However, females remain fully fertile, and pure-breeding miR-184D populations suitable for large-scale releases can be reared under laboratory conditions. Cage invasion experiments show that miR-184D can spread to fixation thereby reducing population fitness, while being able to propagate a separate antimalarial effector gene at the same time. Modelling indicates that the miR-184D drive integrates aspects of population suppression and population replacement strategies into a candidate strain that should be evaluated further as a tool for malaria eradication.


Conflict of interest statement

Competing interests: The authors declare no competing interests.

Figures

Fig. 1
Fig. 1. The miR-184D gene drive.
a Aga-miR-184 (AGAP028779) locus structure, the miR-184D gene drive construct & gRNA target site conservation across species. b Drive transmission in crosses of hemizygous transgenic males or females (D+) to the wild type (++). Each point shows the mean from a pooled independent biological replicate, with the inheritance rates over all replicates and the number of scored progeny indicated. Deviation from Mendelian inheritance rate was calculated using a generalised linear mixed model (P*** < 0.001). Bars originate at the expected inheritance rate and end at the observed overall mean inheritance. c GFP expression in transgenic larvae and adult females of the mir-184D strain and a comparator 3xP3-GFP (nanosD) transgenic line. d Relative miR-184 levels in the whole bodies of sugar-fed females of wild type (++), hemizygous (D+) and homozygous (DD) miR-184D individuals (N = 5 samples) determined by qPCR. Statistical difference from wild type was calculated with Dunnett’s multiple comparisons test (P*** < 0.001). Overlaid are box-and-whisker plots of the interquartile range, with a black line indicating the median value. Whiskers extend to the most extreme data point that is no more than 1.5 times the interquartile range.
Fig. 2
Fig. 2. Fitness and life history traits of miR-184D mosquitoes.
a Fecundity of individual females carrying, or crossed to males carrying, the miR-184D drive element (N ≥ 17 individuals). Significance levels were calculated using an unpaired two-tailed Student’s t-test using Bonferroni correction. b Corresponding hatching rates (N ≥ 17 individuals) and developmental transitions (N ≥ 3 experiments). DD indicates homozygosity and D+ hemizygosity of the miR-184D transgene in the parents of the assessed individuals. Significance levels were calculated using a binomial GLM with replicate as a random effect and Dunnett’s multiple comparisons test (Pns ≥ 0.05, P* < 0.05, and P*** < 0.001). c Flight ability using the IAEA/FAO flight test device (N = 10 experiments). Significance levels were calculated using a binomial GLM with replicate and time of measurement as random effects and individual contrasts were performed with multivariate t-distribution adjustment of P values (Pns ≥ 0.05 and P*** < 0.001). For ac, overlaid are box-and-whisker plots of the interquartile range, with a black line indicating the median value. Whiskers extend to the most extreme data point that is no more than 1.5 times the interquartile range. d Averaged daily survival of sugar-fed female (left) and male (right) wild-type, miR-184D homozygous and miR-184D hemizygous mosquitoes. The miR-184D groups are composed of multiple separate cross-conditions further broken down in Fig. S4. Survival analysis was conducted using a mixed-effects Cox proportional hazards model. Pairwise comparisons were conducted averaged over the effect of sex using Tukey’s method with P value adjustment (P* < 0.05, and P*** < 0.001). Shaded areas indicate the 95% pointwise confidence intervals.
Fig. 3
Fig. 3. Survival of homozygous miR-184D and wild-type female mosquitoes following exposure to diverse stressors.
a Averaged daily survival of mosquitoes fed exclusively on sugar versus mosquitoes taking a blood meal associated with two days of sugar withdrawal. b Averaged daily survival of mosquitoes under starvation conditions. c Averaged daily survival of mosquitoes exposed to oxidative stress by varying levels of paraquat in their sugar water. d Averaged daily survival of mosquitoes taking a blood meal with and without the associated withdrawal of sugar. Results include a replicate performed at 21 °C, and temperature was included as a factor in the statistical model. For all panels, survival analyses were conducted using (mixed-effects) Cox proportional hazards models (Pns ≥ 0.05, P* < 0.05, P** < 0.01, and P*** < 0.001). Sugar water (10% fructose) availability, and when provided, blood meal timing is indicated at the bottom of each panel. Shaded areas indicate the 95% pointwise confidence intervals. The order of each condition in the legend matches the final survival probability ranking of that condition within each genotype.
Fig. 4
Fig. 4. Transcriptomic analysis of homozygous miR-184D and wild type female mosquitoes.
Volcano plots of RNAseq experiments performed on midguts a and the rest of the body b of sugar-fed females. Differentially expressed genes between miR-184D and wild type mosquitoes (P ≤ 0.01 and log2-fold change ≥2) are indicated. P values are Benjamini-Hochberg adjusted. c Venn diagrams showing the total number of differentially expressed genes and overlap between the two tissues. d Summary of enriched GO terms associated with significantly upregulated and downregulated genes in the gut samples. P values are Benjamini-Hochberg adjusted. e Tissue-enrichment calls of significantly upregulated and downregulated genes in the gut samples using the Baker et al. dataset. f Analysis of transgene transcript levels (N ≥ 3 samples), presented as mean FPKM values ± SD.
Fig. 5
Fig. 5. Population invasion experiments.
3 cage populations (1–3) seeded with the miR-184D transgene at a 20% starting allele frequency and 3 cage populations (4–6) seeded with the miR-184D and the MM-CP transgenes at 20% starting frequencies. Shown in a and b is the transgene carrier frequency over multiple generations determined by fluorescent (GFP miR-184D) and molecular genotyping (markerless MM-CP). Panels c and d indicate the egg output per generation of the respective cage populations. A quadratic trendline was fitted to the combined egg output of the three replicates per cage condition over the generations, excluding the setup generation in which all transgene carriers were homozygous. The shaded region shows the standard error (SE) of the fitted line. e Composition of alleles in generation 21 at the miR-184 and CP loci in all 6 populations determined by PCR and subsequent DNA sequencing of non-drive alleles.
Fig. 6
Fig. 6. Modelling gene drive propagation and its effect on malaria transmission.
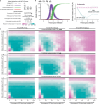
a Gene drive and fitness parameters. The four parameters varied for each set of stochastic simulations are indicated. Those are, the rate of functional resistance rate (circles), loss of function daily mortality rate (dashed arrow), loss of function blood meal mortality rate in homozygotes (solid arrow) and the entomological inoculation rate (triangle). b An exemplary miR-184D allele frequency and clinical case dynamics plot for one set of parameter combinations. Each parameter combination was run 40 times. c Overall malaria reduction was measured over 5 years following gene drive releases compared to the no-release controls. Outcomes are averaged over 40 stochastic simulations.

Similar articles

References

    1. World Health Organization. World Malaria Report 2023 (World Health Organization, 2023).
    1. World Health Organization. Global Technical Strategy for Malaria 2016-2030 (World Health Organization, Geneva, 2015).
    1. Burt, A. Site-specific selfish genes as tools for the control and genetic engineering of natural populations. Proc. R. Soc. B Biol. Sci.270, 921–928 (2003). - PMC - PubMed
    1. Windbichler, N. et al. A synthetic homing endonuclease-based gene drive system in the human malaria mosquito. Nature473, 212–215 (2011). - PMC - PubMed
    1. Gantz, V. M. et al. Highly efficient Cas9-mediated gene drive for population modification of the malaria vector mosquito Anopheles stephensi. Proc. Natl. Acad. Sci. USA112, E6736–E6743 (2015). - PMC - PubMed

LinkOut - more resources