. 2025 Apr 25;16(1):3916.
doi: 10.1038/s41467-025-58983-0.

Evaluation of fetal exposure to environmental noise using a computer-generated model

Affiliations

Evaluation of fetal exposure to environmental noise using a computer-generated model

Pierre Gélat et al. Nat Commun. .

Abstract

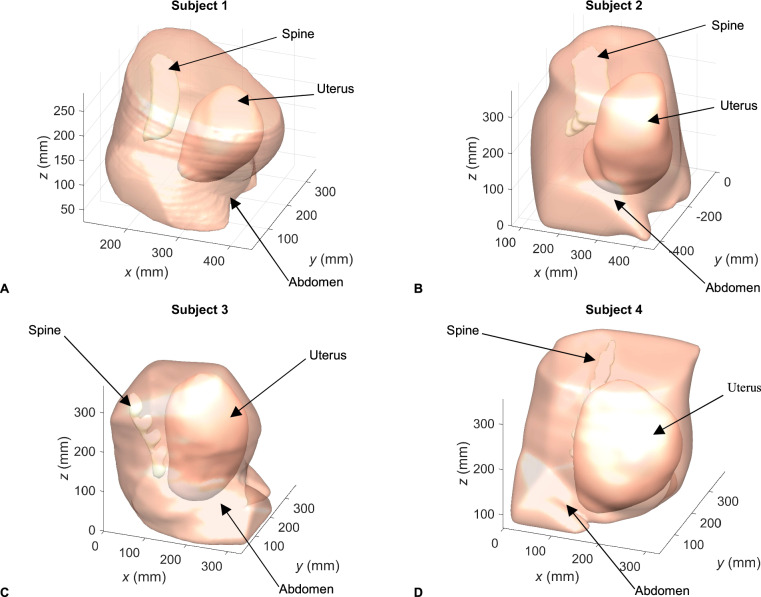
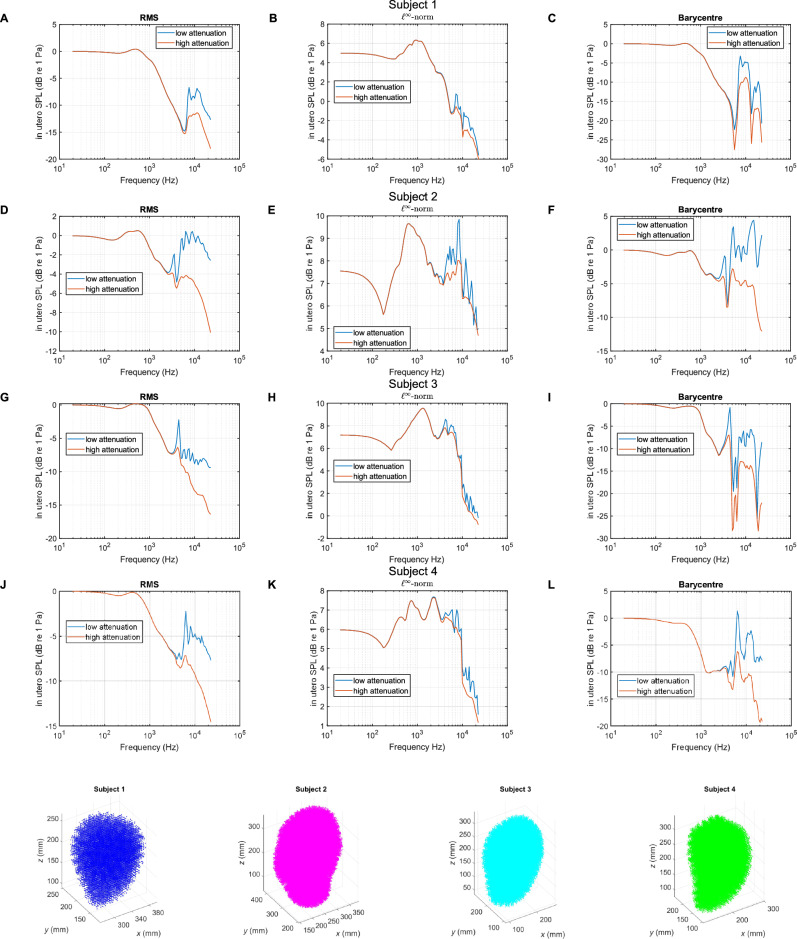
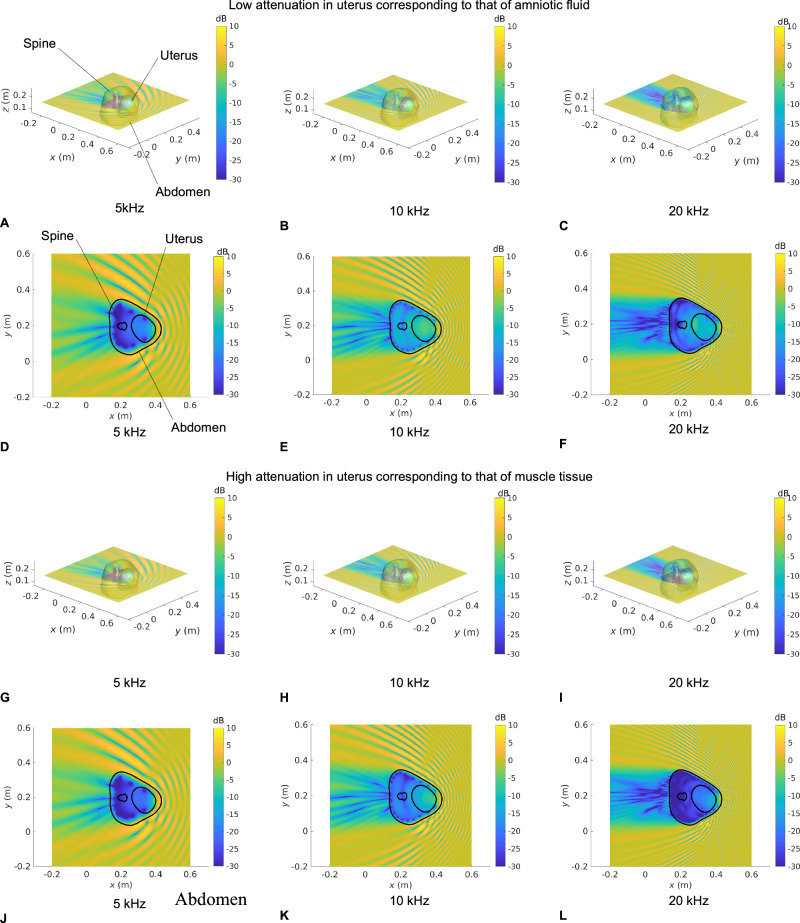
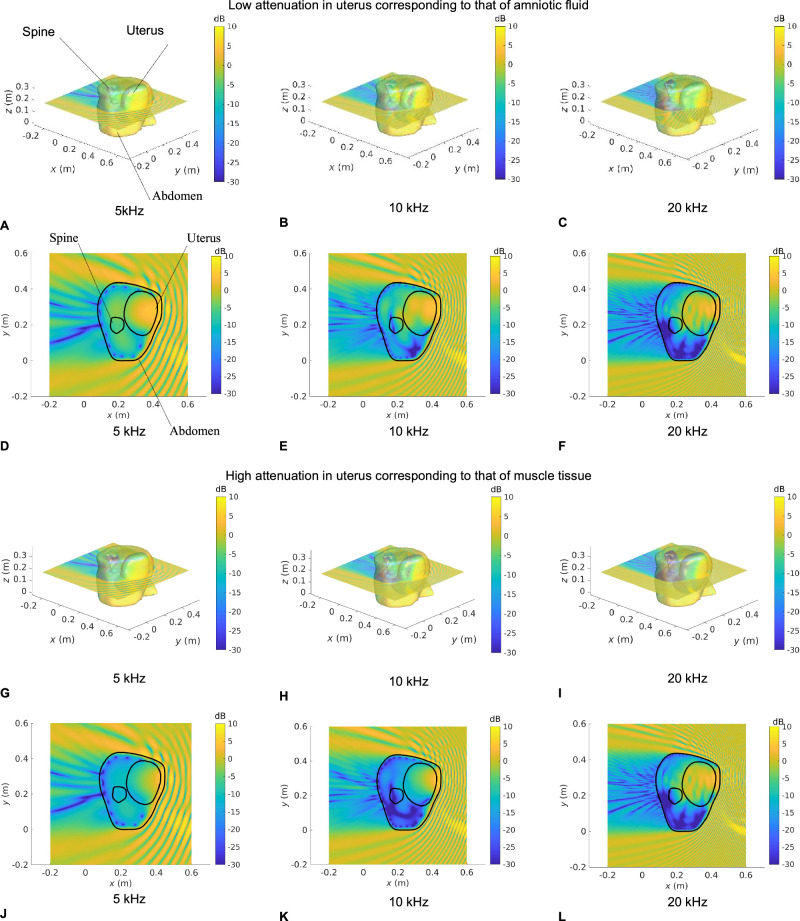
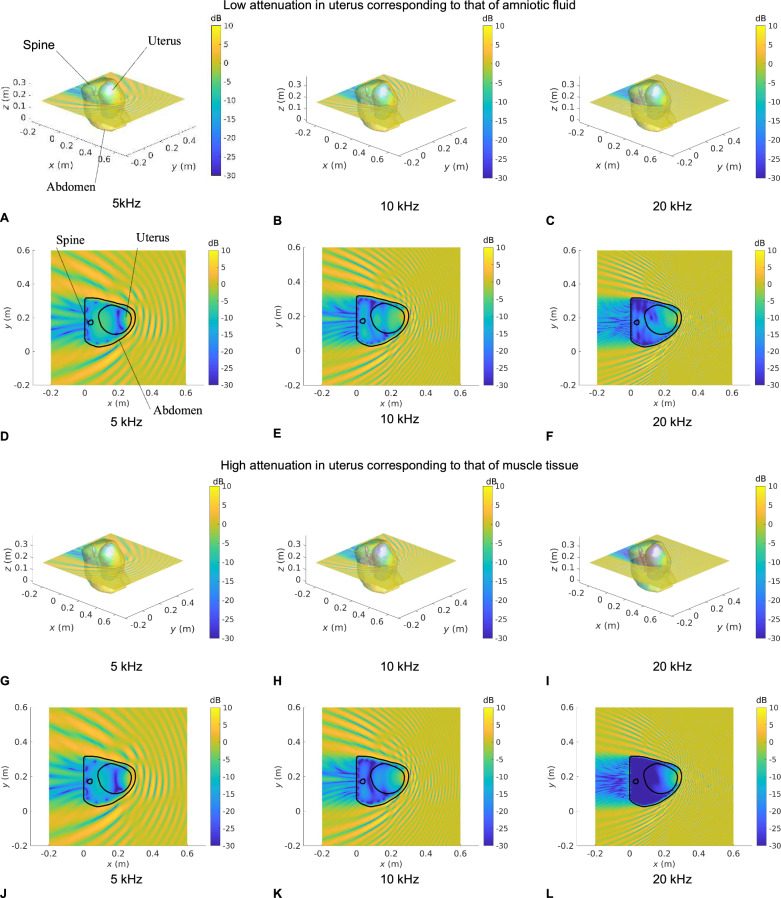
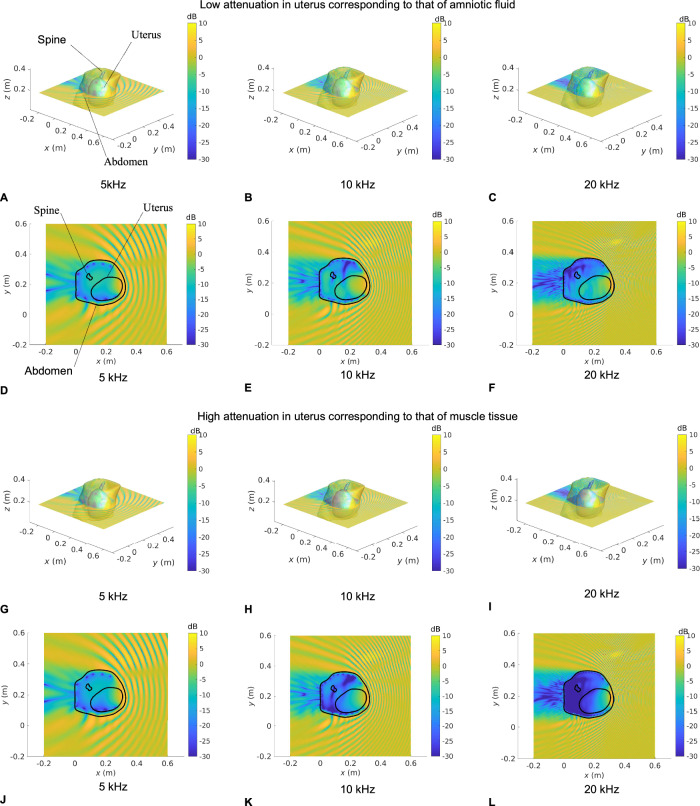
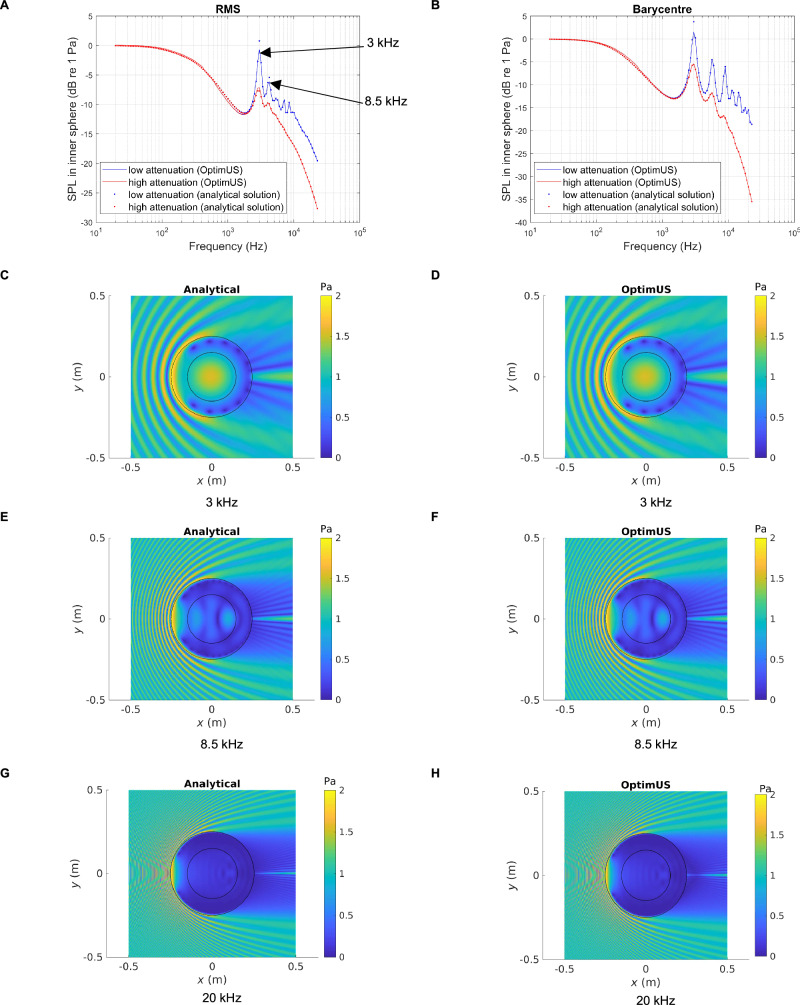
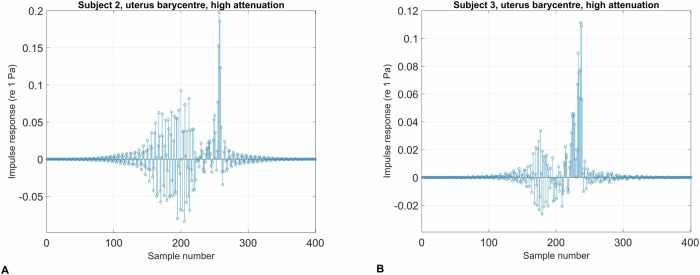
Acoustic noise can have profound effects on wellbeing, impacting the health of pregnant women and their fetus. Mounting evidence suggests neural memory traces are formed by auditory learning in utero. A better understanding of the fetal auditory environment is therefore critical to avoid exposure to damaging noise levels. Using anatomical data from MRI scans of pregnant patients ( N = 4 ) from 24 weeks of gestation, we develop a computational model to quantify fetal exposure to acoustic field. We obtain acoustic transfer characteristics across the human audio range and pressure maps in transverse planes passing through the uterus at 5 kHz, 10 kHz and 20 kHz, showcasing multiple scattering and modal patterns. Our calculations show that the sound transmitted in utero is attenuated by as little as 6 dB below 1 kHz, confirming results from animal studies that the maternal abdomen and pelvis do not shelter the fetus from external noise.


Conflict of interest statement

Competing interests: The authors declare no competing interests. None of the contents of this manuscript has been previously published or is under consideration elsewhere. All the authors have read and approved the final version of the manuscript before submission.

Figures

Fig. 1
Fig. 1. Anatomical regions of datasets used in computational meshes.
This figure shows the surface boundaries of the three anatomical regions considered for datasets used in computational meshes: A Subject 1, B Subject 2, C Subject 3, and D Subject 4. The anatomical regions are the maternal abdomen, the spine and the uterus.
Fig. 2
Fig. 2. Sound pressure level inside the uterus as a function of frequency for a unit amplitude incident plane wave.
Frequency response plots of the sound pressure level (SPL) inside the womb were obtained for a unit amplitude plane wave traveling towards the front of the body, in the negative x direction. Such a plane wave is described mathematically by the real part of ei(ωtkx) where k is the wave number in air and ω is the angular frequency. Three metrics of the sound pressure level inside the uterus are plotted for datasets associated with Subjects 1, 2, 3 and 4. A, D, G and J correspond to the SPL resulting from the spatial RMS of the acoustic pressure magnitude inside the uterus; B, E, H and K describe the SPL associated with the l-norm, effectively corresponding to the maximum pressure magnitude at the sampled points; C, F, I and L represent the SPL resulting from the acoustic pressure magnitude at the barycentre of the uterus. Uterus points within a solid angle of 0.5 steradian from the surface of the mesh were discarded in the analysis as the BEM can overestimate field potentials close to a surface. The field potential evaluation points for subjects 1, 2, 3, and 4 are displayed below in blue, magenta, cyan, and green, respectively.
Fig. 3
Fig. 3. Sound pressure level maps at 5, 10, and 20 kHz for Subject 1 for an incident unit amplitude plane wave.
SPL inside all anatomical regions for an incident unit amplitude plane wave traveling in the negative x direction. The acoustic attenuation coefficient in the uterus is that of amniotic fluid in A−F and that of muscle tissue in GL. 3D maps of the SPL re 1 Pa are shown in A−C and G−I. DF and JL show a slice of the SPL re 1 Pa in the transverse plane passing through the barycentre of the uterus. Anatomical groups and contours are labeled in A and D, respectively.
Fig. 4
Fig. 4. Sound pressure level maps at 5, 10, and 20 kHz for Subject 2 for an incident unit amplitude plane wave.
SPL inside all anatomical regions for an incident unit amplitude plane wave traveling in the negative x direction. The acoustic attenuation coefficient in the uterus is that of amniotic fluid in (AF) and that of muscle tissue in (G–L). 3D maps of the SPL re 1 Pa are shown in (AC) and (GI). DF and JL show a slice of the SPL re 1 Pa in the transverse plane passing through the barycentre of the uterus. Anatomical groups and contours are labeled in (A) and (D), respectively.
Fig. 5
Fig. 5. Sound pressure level maps at 5, 10, and 20 kHz for Subject 3 for an incident unit amplitude plane wave.
SPL inside all anatomical regions for an incident unit amplitude plane wave traveling in the negative x direction. The acoustic attenuation coefficient in the uterus is that of amniotic fluid in A−F and that of muscle tissue in GL. 3D maps of the SPL re 1 Pa are shown in A−C and G−I. D−F and J−L show a slice of the SPL re 1 Pa in the transverse plane passing through the barycentre of the uterus. Anatomical groups and contours are labeled in (A) and (D), respectively.
Fig. 6
Fig. 6. Sound pressure level maps at 5, 10 and 20 kHz for Subject 4 for an incident unit amplitude plane wave.
SPL inside all anatomical regions for an incident unit amplitude plane wave traveling in the negative x direction. The acoustic attenuation coefficient in the uterus is that of amniotic fluid in (AF) and that of muscle tissue in (GL). 3D maps of the SPL re 1 Pa are shown in (A−C) and (G−I). DF and JL show a slice of the SPL re 1 Pa in the transverse plane passing through the barycentre of the uterus. Anatomical groups and contours are labeled in (A) and (D), respectively.
Fig. 7
Fig. 7. Validation of OptimUS computational model against the analytical solution for nested spheres: frequency response and acoustic pressure field visualization.
Sound pressure level transmission inside the inner sphere with dimensions representative of the uterus as a function of frequency for a unit amplitude incident plane wave traveling in the positive x direction for two concentric spheres, of radii 0.25 m and 0.15 m, obtained from A the SPL resulting from the spatial RMS of the acoustic pressure magnitude inside the inner sphere with two resonances shown at 3 kHz and 8 kHz, and B the acoustic pressure magnitude at the center of the inner sphere. The exterior medium is air. The medium bounded by the exterior domain and the inner sphere has the properties of abdominal tissue and the inner sphere those of amniotic fluid. Acoustic pressure magnitude in the Cartesian xy plane, describing the interactions between the incident plane wave and the concentric spheres at excitation frequencies of 3 kHz, 8.5 kHz, and 20 kHz is shown in (C, E and G) which are obtained using the analytical solution. D, F, and H correspond to the nested BEM solution provided by OptimUS.
Fig. 8
Fig. 8. Impulse response generated from the acoustic pressure inside the uterus.
Impulse response generated from the complex acoustic pressure at A, the barycentre of the uterus of Subject 2 and B, the barycentre of the uterus of Subject 3, in response to a unit amplitude plane wave incident on the abdomen traveling in the negative x direction.

Update of

Similar articles

References

    1. Jauniaux, E., Wylie, B. J., Verheijen, E., Conry, J. & Papageorghiou, A. Women’s health in the anthropocene. BJOG: Int. J. Obstet. Gynaecol.131, 531–532 (2024). - PubMed
    1. World Health Organization. Environmental Noise Guidelines for the European Region (World Health Organization, 2018).
    1. European Environment Agency. Healthy Environment, Healthy Lives: How the Environment Influences Health and Well-Being in Europe (European Environment Agency, 2020)
    1. Basner, M. et al. Auditory and non-auditory effects of noise on health. Lancet383, 1325–1332 (2014). - PMC - PubMed
    1. Newbury, J. B. et al. Air and noise pollution exposure in early life and mental health from adolescence to young adulthood. JAMA Netw. Open7, e2412169 (2024). - PMC - PubMed