. 2025 Apr 25;16(1):3873.
doi: 10.1038/s41467-025-58907-y.

IL-17A-producing NKp44(-) group 3 innate lymphoid cells accumulate in Familial Adenomatous Polyposis duodenal tissue

Affiliations

IL-17A-producing NKp44(-) group 3 innate lymphoid cells accumulate in Familial Adenomatous Polyposis duodenal tissue

Kim M Kaiser et al. Nat Commun. .

Abstract

Familial adenomatous polyposis (FAP) is an inherited gastrointestinal syndrome associated with duodenal adenoma formation. Even among carriers of the same genetic variant, duodenal phenotypes vary, indicating that additional factors, such as the local immune system, play a role. We observe an increase in duodenal IL-17A(+)NKp44(-) innate lymphoid type 3 cell (ILC3) in FAP, localized near the epithelium and enriched in adenomas and carcinomas. Elevated IL1B, IL23A, and DLL4 transcript levels correlate with IL-17A(+)NKp44(-)ILC3 accumulation, and in vitro studies with duodenal organoids confirmed this relationship. Bulk RNA sequencing reveals upregulated Reactive oxygen species (ROS)-inducing enzymes DUOX2 and DUOXA2 in FAP adenomas. IL-17A-stimulated FAP organoids show increased DUOX2/DUOXA2 expression, Duox2 protein, and ROS production, leading to DNA damage, suggesting a mechanism by which these immune cells promote tumorigenesis. These findings suggest IL-17A(+)NKp44(-)ILC3s may contribute to a local environment that makes the epithelium more submissive for oncogenic transformation in FAP.


Conflict of interest statement

Competing interests: R.H. and J.N. received endoscopic equipment on loan from Fujifilm, Germany. Robert Hüneburg has received consulting fees for medical advice from CPP-FAP, One Two Therapeutics, and Janssen Pharmaceuticals. C.P.S. has received speaker honoraria from Falk Pharma, Eisai, Astellas, Chiesi, MSD, and support for seminars from Gilead, Bristol-Myers Squibb, Abbvie, MSD, Norgine, Tillots Pharma, Eisai, Janssen, Falk Foundation, and consulting fees for medical advice from Fa. Schwabe, Astra Zeneca, Eisai and Astellas. The remaining authors declare no competing interests.

Figures

Fig. 1
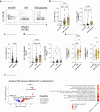
Fig. 1. Increased frequencies of CD127( + )CD117( + )ILC3 in FAP duodenal tissue.
a Study design. This figure includes images from Servier Medical Art (https://smart.servier.com/category/anatomy-and-the-human-body/digestive-system/https://smart.servier.com/smart_image/simple-columnar-epithelium), licensed under a Creative Commons Attribution 4.0 Unported License (https://creativecommons.org/licenses/by/4.0). The images were modified to depict tumor tissue within the epithelium. b Representative FACS plots showing gating strategy from duodenal lymphocytes to ILC1s (yellow), ILC2s (blue), and ILC3s (green). Lineage for this staining is defined as CD3, CD4, CD5, CD14, CD19, CD20, TCRγδ, TCRαβ, BDCA-2, CD1a, CD34, NKp80, CD94, FcεR1a and CD123. c Proportion of total Lin(−)CD127(+)ILCs among CD45(+) cells in duodenal adenomatous (n = 15) and normal (n = 76) duodenal tissue of FAP patients, as well as normal duodenal mucosa (n = 24) of non-FAP controls (left panel). Frequencies of CD45(+) cells in duodenal adenomatous (n = 15) and normal mucosa (n = 76) of FAP patients, and normal mucosa (n = 24) of non-FAP controls (right panel). Mean ± SD. d Proportion of total Lin(−)CD127( + ) ILC1, ILC2, and ILC3 among CD45(+) cells in duodenal adenomatous (n = 15) and normal (n = 76) duodenal tissue of FAP patients, as well as normal duodenal mucosa (n = 24) of non-FAP controls. Mean ± SD. e Proportion of ILC subsets ILC1(yellow), ILC2(blue), and ILC3(green) among Lin(−)CD127(+) cells in duodenal adenomatous (n = 15) and normal (n = 76) tissue of FAP patients, and normal mucosa (n = 24) of non-FAP controls. f Representative MELC images of FAP normal tissue showing ILC3 cells, indicated by white arrows, with CD117(yellow), CD3(blue), EpCAM(green), and nucleus stainings(violet). ILC3 cells are defined in Supplementary Fig. 3 as CD45( + )CD117( + )CD3(−)CD14(−)CD16(−)CD19(−)EpCAM(−) lymphoid cells. The white scale bar represents 100 µm. Based on three independent biological replicates. Statistical significance analyzed by the Kruskal–Wallis (KW) test corrected for multiple comparisons using FDR (Benjamini, Krieger, Yekutieli). q-values are indicated; ns = not significant. Non-FAP is white, normal FAP is ochre and FAP adenomas are brown in the c&d subdivisions diagrams.
Fig. 2
Fig. 2. Increased frequencies of IL-17A-producing NKp44(−)ILC3 in FAP duodenal tissue.
a Representative dot blot displaying intracellular IL-17A production of ILC3 in adenomatous and normal mucosa of FAP compared to normal mucosa of non-FAP controls following PMA/Ionomycin stimulation. b Percentages of IL-17A( + )ILC3 in duodenal adenomatous (n = 7) and normal mucosa (n = 26) of FAP patients, and normal mucosa (n = 10) of non-FAP controls following PMA/Ionomycin stimulation (left panel). Gating strategy of respective subsets in Supplementary Fig. 9a. Mean ± SD. Frequency of IL-17A( + )ILC3 among CD45(+) cells in duodenal adenomatous (n = 7) and normal (n = 26) mucosa of FAP patients and normal mucosa (n = 10) of non-FAP controls following PMA/Ionomycin stimulation (right panel). Gating strategy of respective subsets is in Supplementary Fig. 9a. c Percentages of IL-17A(+)cells among duodenal NKp44(+)(blue)(from 43 donors) and NKp44(−)ILC3(light blue)(from 43 donors) following PMA/Ionomycin stimulation. Gating strategy of respective subsets is in Supplementary Fig. 9a. d Proportions of IL-17A(+)cells within NKp44(+) and NKp44(−)ILC3 in duodenal adenomatous (n = 7) and normal mucosa (n = 26) of FAP patients, and normal mucosa (n = 10) of non-FAP controls following PMA/Ionomycin stimulation. Gating strategy of respective subsets is in Supplementary Fig. 9a. e Frequency of NKp44(−)ILC3 among CD45(+) cells in duodenal adenomatous (n = 15) and normal mucosa (n = 76) of FAP patients and normal mucosa (n = 24) of non-FAP controls. Gating strategy of respective subsets in Supplementary Fig. 9a. Mean ± SD. f Bulk RNA-seq analysis showing differentially expressed genes (DEGs) (up- in red and downregulated genes in blue) in a volcano plot with adjusted p-value and Log2 fold-change (left panel), with the corresponding enrichment analysis indicating significant pathways based on the enrichment score (white-red scale)(right panel). Sorting strategy for respective subsets in Supplementary Fig. 9c. Statistical significance analyzed by Two-tailed Wilcoxon matched-pairs signed rank test (c), Kruskal–Wallis (KW) test (b, d, e) corrected for multiple comparisons using FDR (Benjamini, Krieger, Yekutieli). q(KW test)- and p(Wilcoxon)-values are indicated; ns = not significant. DEGs (f) were analyzed using DESeq2 with a two-sided Wald test. p-values were adjusted using the Benjamini–Hochberg method, and results were filtered for adjusted p < 0.05 and absolute log2 fold-change ≥0.5 using the ashr method. Non-FAP is white, normal FAP is ochre, and FAP adenomas are brown in the b, d, & e subdivision diagrams.
Fig. 3
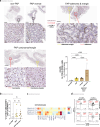
Fig. 3. Epithelial localization and retention phenotype of IL-17A-producing ILC3s in FAP adenoma.
a Representative IHC stainings with IL-17A(red) and CD3(brown) of non-FAP(left panel), FAP normal (upper left panel), central (red square) adenomatous inclusive margin tissue (yellow square)(upper right panel), and FAP carcinoma (red square) inclusive margin tissue (yellow square)(lower left panel) with white arrows indicating CD3(−) and IL-17A(+)cells. Scale bars: 50 µm for magnified images, 500 µm for non-FAP/FAP-normal/FAP-adenoma & margin overviews, and 800 µm for FAP-carcinoma/margin overviews. Lower right panel: Counts of IL-17A( + )CD3(−) cells in IHC stainings including non-FAP (n = 3), FAP normal (n = 4), and FAP adenoma with defined margin and central adenoma region (n = 4), were analyzed. Mean values for each individual count were calculated from at least three regions of equal area of 440’000 µm2 per biopsy sample. Mean ± SD. b Percentages of IL-17A( + )CD4( + )CD5(+)Lin(+) cells of CD45(+) cells in non-FAP (n = 8), normal FAP(n = 8) and adenomatous FAP(n = 8) tissue. Gating strategy of respective subsets in Supplementary Fig. 9e. Mean ± SD. c Heatmap showing z-score of flow cytometric evaluated expressions of indicated markers, gated on NKp44(+) and NKp44(−)ILC3s following PMA/Ionomycin stimulation, split into IL-17(−) and IL-17(+) subsets, from three subjects each of non-FAP, normal FAP, and FAP adenoma (blue-yellow-red scaling). Gating strategy of respective subsets in Supplementary Fig. 9c. d Representative dot plots of CD103 and β7 integrin from FAP normal and FAP adenoma patients on IL-17A(+) and IL-17A(−) NKp44(−)ILC3 following PMA/Ionomycin stimulation. CD103( + )β7(+) corresponds to αEβ7 expression, and CD103(−)β7(+) corresponds to α4β7 expression. Gating strategy of respective subsets in Supplementary Fig. 9d. Statistical significance analyzed by Two-way ANOVA (mixed model) with two-sided tests (a) and Kruskal–Wallis (KW) test (b) both corrected for multiple comparisons using FDR (Benjamini, Krieger, Yekutieli). q-values are indicated; ns = not significant. Non-FAP is white, normal FAP is ochre, and FAP adenomas are brown in the a & b subdivision diagrams.
Fig. 4
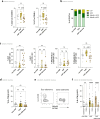
Fig. 4. Increased frequency of IL-17A-producing ILC3s in FAP duodenal tissue.
a Frequency of total Lin(−)CD127(+)ILCs (left) and ILC3 (right) among CD45(+) cells in colonic adenomatous (n = 9) and normal mucosa (n = 19) of FAP patients and normal mucosa (n = 9) of non-FAP controls. Gating strategy of respective subsets in Fig. 1b. Mean ± SD. b ILC1(yellow), ILC2(blue), NKp44(−)ILC3(dark green), and NKp44(−)ILC3(light green) distribution in colonic adenomatous and normal mucosa of FAP patients and non-FAP controls. Gating strategy of respective subsets in Fig. 1b. c Percentages of ILC1, ILC2 and NKp44(+) and NKp44(−) colonic ILCs in colonic adenomatous (n = 9) and normal mucosa (n = 19) of FAP patients and normal mucosa (n = 9) of non-FAP controls. Gating strategy of respective subsets in Fig. 1b. Mean ± SD. d Percentages of IL-17A( + )ILC3 in colonic adenomatous (n = 8) and normal mucosa (n = 23) of FAP patients and normal mucosa (n = 10) of non-FAP controls. Gating strategy of respective subsets in Supplementary Fig. 9a. Mean ± SD. e Representative image and f percentages of IL-17A (+)ILC3 in colonic and duodenal adenomatous (Duodenum: n = 7; Colon: n = 8) and normal mucosa (Duodenum: n = 26; Colon: n = 23) of FAP patients and normal mucosa (Duodenum: n = 10; Colon: n = 10) of non-FAP controls. Gating strategy of respective subsets in Supplementary Fig. 9a. Mean ± SD. Statistical significance analyzed by Kruskal–Wallis (KW) test (a, c, d) and Two-tailed Mann–Whitney test (f) corrected for multiple comparisons using FDR (Benjamini, Krieger, Yekutieli). q(KW)- and p(Mann–Whitney)-values are indicated; ns = not significant. Non-FAP is white, normal FAP is ochre, and FAP adenomas are brown in the a, c, d, & f subdivision diagrams.
Fig. 5
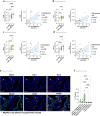
Fig. 5. Increased duodenal expression of IL1B, IL23A, DLL1, and DLL4 in FAP.
a Left panel: IL1B mRNA expression in duodenal adenomatous (n = 8) and normal mucosa (n = 33) of FAP patients and normal mucosa (n = 14) of non-FAP controls. Mean ± SD. Right panel: Pearson correlation between duodenal IL1B mRNA expression and the proportion of IL-17A-producing NKp44(−) cells within total ILC3s (n = 25). b Left panel: IL23A mRNA expression in duodenal adenomatous (n = 8) and normal mucosa (n = 33) of FAP patients and normal mucosa (n = 14) of non-FAP controls. Mean ± SD. Right panel: Pearson correlation between duodenal IL23A mRNA expression and the proportion of IL-17A-producing NKp44(−) cells within total ILC3s (n = 25). c Left panel: DLL1 mRNA expression in duodenal adenomatous (n = 8) and normal mucosa (n = 33) of FAP patients and normal mucosa (n = 14) of non-FAP controls. Mean ± SD. Right panel: Pearson correlation between duodenal DLL1 mRNA expression and the proportion of IL-17A-producing NKp44(−) cells within total ILC3s (n = 25). d Left panel: DLL4 mRNA expression in duodenal adenomatous (n = 8) and normal mucosa (n = 33) of FAP patients and normal mucosa (n = 14) of non-FAP controls. Mean ± SD. Right panel: Pearson correlation between duodenal DLL4 mRNA expression and the proportion of IL-17A-producing NKp44(−) cells within total ILC3s (n = 25). mRNA expression levels are expressed in relation to mRNA expression levels of EEF1A1. e Representative MELC images of FAP normal tissue showing NKp44(−)ILC3 cells, indicated by white arrows, with CD117(white), DLL1(red), DLL4(violet), EpCAM(green), CD31(yellow) and nucleus stainings(blue). ILC3 cells are defined in Supplementary Fig. 6b as CD45( + )CD117( + )CD3(−)CD14(−)NKp44(−)CD16(−)EpCAM(−) lymphoid cells. White scale bar represents 20 µm. Based on three independent biological replicates. f IL-17A concentration in the supernatant of tonsil NKp44(−)ILC3 and controls (each 3 donors) after 3 days of culturing on OP9, OP9-DL1, and OP9-DL4 cells or unstimulated and stimulated OP9-DL4 alone (n = 6 replicates), respectively. Mean ± SD. Colors as indicated. Statistical significance analyzed by the Kruskal–Wallis (KW) test (a, b, c, d, f) corrected for multiple comparisons using FDR (Benjamini, Krieger, Yekutieli). q-values are indicated. Pearson correlation with corresponding R² and p-values is shown. Non-FAP is white, normal FAP is ochre and FAP adenomas are brown in the a, b, c, & d subdivision diagrams.
Fig. 6
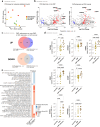
Fig. 6. Transcriptome analysis of duodenal tissue in FAP vs. non-FAP controls.
a Principal component analysis of bulk RNA-seq data from duodenal normal(yellow) and adenomatous mucosa of FAP patients(red) and normal mucosa of non-FAP controls (green). Each point represents the gene expression profile of a single sample, with colors indicating different patient groups. b Volcano plot displaying log2 fold-changes (FC) and FDR-adjusted p-values comparing adenomatous mucosa of FAP patients and normal mucosa of non-FAP controls (left panel). Differentially expressed transcripts (log2 FC > | 1.5 | , p(adj) <0.05) are highlighted in red or blue, depending on up- or downregulation in adenomatous mucosa, respectively. Additionally, the right panel shows a comparison between FAP adenoma and FAP normal mucosa. c Venn diagram illustrating the overlap of up- and downregulated differentially expressed genes (DEGs) between two comparisons: FAP adenoma vs. FAP normal(blue) and FAP adenoma vs. non-FAP normal(red). d qPCR results comparing gene expression in duodenal normal (n = 17) and adenomatous (n = 9) mucosa of FAP patients and normal mucosa (n = 13) of non-FAP controls. mRNA expression levels are relative to EEF1A1 expression. Mean ± SD. e Bulk RNA-seq analysis showing a heatmap of the enrichment scores (up&down) for significant pathways, based on comparisons of FAP adenoma vs. FAP normal and FAP adenoma vs. non-FAP normal(blue-red scaling). Error bars represent SD. Statistical significance analyzed by the Kruskal–Wallis (KW) test corrected for multiple comparisons using FDR (Benjamini, Krieger, Yekutieli). q-values are indicated; ns = not significant. Non-FAP is white, normal FAP is ochre, and FAP adenomas are brown in the d subdivision diagrams.
Fig. 7
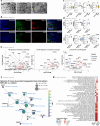
Fig. 7. IL-17A increased DUOX2/DUOXA2 expression in duodenal organoids.
a Duodenal organoids on day 1, 2, and 4. Distance is indicated in a 200 µm bar. Based on five independent biological replicates. b Hoechst(blue), Lysozyme (LYZ)(red), Mucin-2 (Muc-2)(red) and Epcam(green) immunofluorescence staining in duodenal organoids. Distance is indicated in a 20 µm bar. Based on five independent biological replicates. c MUC-2 (non-FAP, n = 14; FAP, n = 14), KI67 (non-FAP, n = 12; FAP, n = 9), LYZ (non-FAP, n = 6; FAP, n = 12) and LGR5 (non-FAP, n = 12; FAP, n = 13) mRNA expression in duodenal organoids of non-FAP controls(white bar) and FAP patients(ochre bar). Box plot showing the median (center line), interquartile range (box bounds: 25th–75th percentile), and range (whiskers: min–max). d qPCR results comparing gene expression of duodenal organoids (n = 6) with(white bar) or without 20 h IL-17A stimulation(blue bar). mRNA expression levels are relative to EEF1A1 expression. Box plot showing the median (center line), interquartile range (box bounds: 25th–75th percentile), and range (whiskers: min–max). e Volcano plots displaying log2-fold-changes (FC) and FDR-adjusted p-values comparing FAP organoid IL-17A stimulated vs. unstimulated (left panel), non-FAP organoid IL-17A stimulated vs. unstimulated (middle panel), and IL-17A stimulated condition: FAP vs. non-FAP organoids (right panel). Differentially expressed transcripts (log2 FC > | 1.5 | , p(adj) < 0.05) are highlighted in red or blue, depending on up- or downregulation in the comparisons, respectively. f Gene-pathway network visualization of differentially expressed genes in IL-17A stimulated vs. unstimulated duodenal FAP organoids. Nodes represent individual genes, with sizes proportional to adjusted p-values and colors indicating log fold-changes (blue-yellow scaling). Edges denote known protein-protein interactions based on STRING database data (see Supplementary Table 2). g Bulk RNA-seq analysis showing a heatmap of the enrichment scores (up & down) for significant pathways, based on comparisons of FAP organoid IL-17A stimulated vs. unstimulated and non-FAP organoid IL-17A stimulated vs. unstimulated (up: white-red scaling; down: white-blue scaling). Statistical significance was analyzed by two-tailed Mann–Whitney test (c) and Two-tailed Wilcoxon matched-pairs signed rank test (d). p-values are indicated; ns = not significant. DEGs (eg) were analyzed with a two-sided moderated t-test. p-values were adjusted for multiple comparisons using the Benjamini–Hochberg method.
Fig. 8
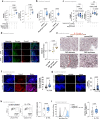
Fig. 8. IL-17A-Induced oxidative stress and Duox2-mediated DNA damage in FAP pathophysiology.
a DUOX2 and DUOXA2 mRNA expression in duodenal organoid cultures incubated alone (n = 8)(white) or in the presence of NKp44(+)ILC3 (n = 3)(light blue), ILC1 (n = 3)(yellow), or NKp44(−)ILC3 (n = 8)(blue) and within the matrigel for 4 days. Every other day 10 ng/ml IL-23A and IL-1β were added to the supernatant in each condition. b DUOX2 and DUOXA2 mRNA expression in duodenal organoid cultures (n = 10) incubated in the presence(blue) or absence(white) of supernatants of NKp44(−)ILC3s on OP9-DL4 feeder cells. Box plot showing the median (center line), interquartile range (box bounds: 25th–75th percentile), and range (whiskers: min–max). c DUOX2 and DUOXA2 mRNA levels were measured in duodenal organoid cultures (n = 10) incubated(light blue) with or without(white) NKp44(−)ILC3 supernatants in the presence or absence of an IL-17A-specific blocking antibody(green) or isotype control(blue). Box plot showing the median (center line), interquartile range (box bounds: 25th–75th percentile), and range (whiskers: min–max). d Representative IF images with Duox2(red), Hoechst(nucleus)(blue), and EpCAM(green), and with merged images (left panel, scale bar: 50 µm). Right panel: mean Duox2 staining intensity (normalized to nuclear area with Hoechst) across non-FAP(white bar), FAP(ochre bar), and FAP adenoma tissues (brown bar) (n = 3 per group, technical replicates are listed in the Source Data table). e Representative IHC images showing Duox2(brown) and IL-17A(red) in non-FAP, normal FAP, FAP adenoma with margin, and FAP carcinoma tissue. White arrows indicate IL-17A(+)cells, and black arrows indicate Duox2(+) epithelial cells. Scale bar represents 100 µm. Based on five independent biological replicates. Red line marks the boundary between margin and central adenoma. f Left panel: representative IF staining of Duox2(red) and Hoechst(nucleus)(blue) in duodenal organoids, unstimulated and IL-17A-stimulated for three days. Scale bar represents 50 µm. Right panel: Duox2 mean intensity relative to Hoechst staining, with unstimulated (n = 17 organoids)(white) and IL-17A-stimulated samples (n = 14 organoids)(blue). Box plot showing the median (center line), interquartile range (box bounds: 25th–75th percentile), and range (whiskers: min–max). g Left panel: representative IF staining of γH2AX(red) and Hoechst(nucleus)(blue) in duodenal organoids, unstimulated and IL-17A-stimulated for three days. Scale bar represents 50 µm. Right panel: frequency of γH2AX(+)cells, with unstimulated samples (n = 31 organoids)(white) and IL-17A-stimulated organoids (n = 29 organoids)(blue). Box plot showing the median (center line), interquartile range (box bounds: 25th–75th percentile), and range (whiskers: min–max). h Left panel: representative flow cytometric staining of γH2AX in duodenal organoids, unstimulated and IL-17A-stimulated for one day. Right panel: frequency of γH2AX(+) cells, with unstimulated (n = 8)(white) and IL-17A-stimulated organoid cultures (n = 8)(blue). Box plot showing the median (center line), interquartile range (box bounds: 25th–75th percentile), and range (whiskers: min–max). i Left panel: representative flow cytometric staining of DC-FDA for ROS detection in duodenal organoids, unstimulated(white) and IL-17A-stimulated(blue) for one day, with FMO(Fluorescence minus One) control(gray). Right panel: geometric mean intensity of DC-FDA staining, with unstimulated (n = 11)(white) and IL-17A-stimulated organoid cultures (n = 11)(blue). Box plot showing the median (center line), interquartile range (box bounds: 25th–75th percentile), and range (whiskers: min–max). Statistical significance analyzed by Two-tailed Mann–Whitney test (b, f, g), Two-tailed Wilcoxon matched-pairs signed rank test (h, i), Kruskal–Wallis (KW) test (a), and Two-way ANOVA (mixed model) with two-sided tests (d) and Two-tailed Friedman test (c) corrected for multiple comparisons using FDR (Benjamini, Krieger and Yekutieli). q(KW, Friedman and ANOVA-mixed model)- and p(Mann–Whitney, Wilcoxon)-values are indicated; ns = not significant.

References

    1. Nishisho, I. et al. Mutations of chromosome 5q21 genes in FAP and colorectal cancer patients. Science253, 665–669 (1991). - PubMed
    1. Groden, J. et al. Identification and characterization of the familial adenomatous polyposis coli gene. Cell66, 589–600 (1991). - PubMed
    1. Muto, T., Bussey, H. J. & Morson, B. C. The evolution of cancer of the colon and rectum. Cancer36, 2251–2270 (1975). - PubMed
    1. Gurbuz, A. K. et al. Desmoid tumours in familial adenomatous polyposis. Gut. 35, 377–381 (1994). - PMC - PubMed
    1. Groen, E. J. et al. Extra-intestinal manifestations of familial adenomatous polyposis. Ann. Surg. Oncol.15, 2439–2450 (2008). - PMC - PubMed

MeSH terms