. 2025 Apr 25;10(1):154.
doi: 10.1038/s41392-025-02194-y.

A20 attenuates oxidized self-DNA-mediated inflammation in acute kidney injury

Affiliations

A20 attenuates oxidized self-DNA-mediated inflammation in acute kidney injury

Hanwen Li et al. Signal Transduct Target Ther. .

Abstract

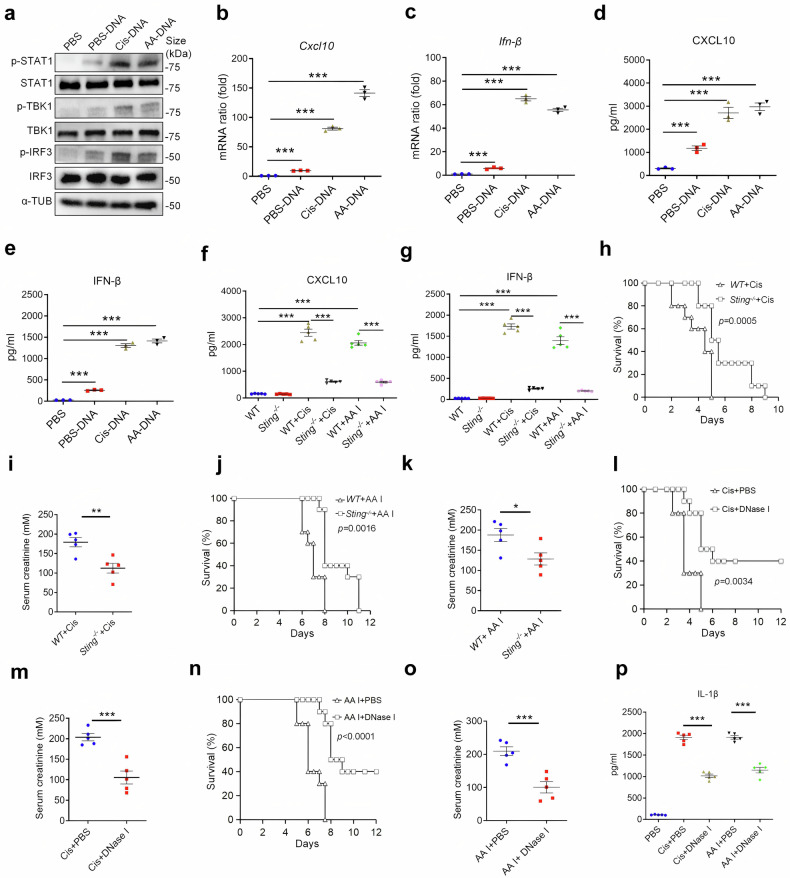
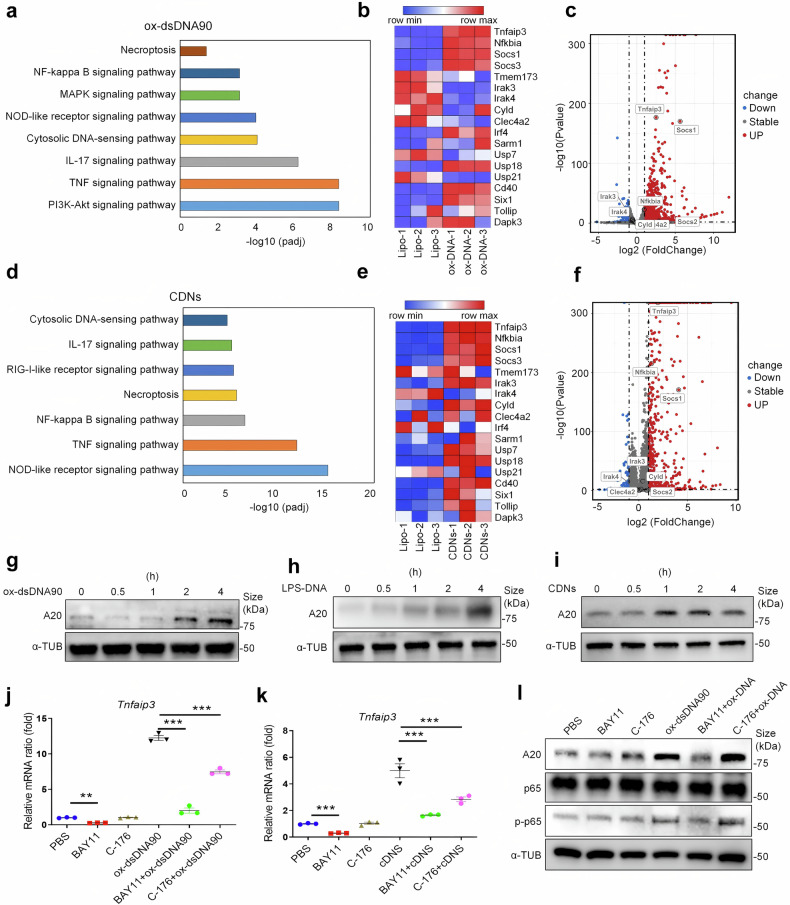
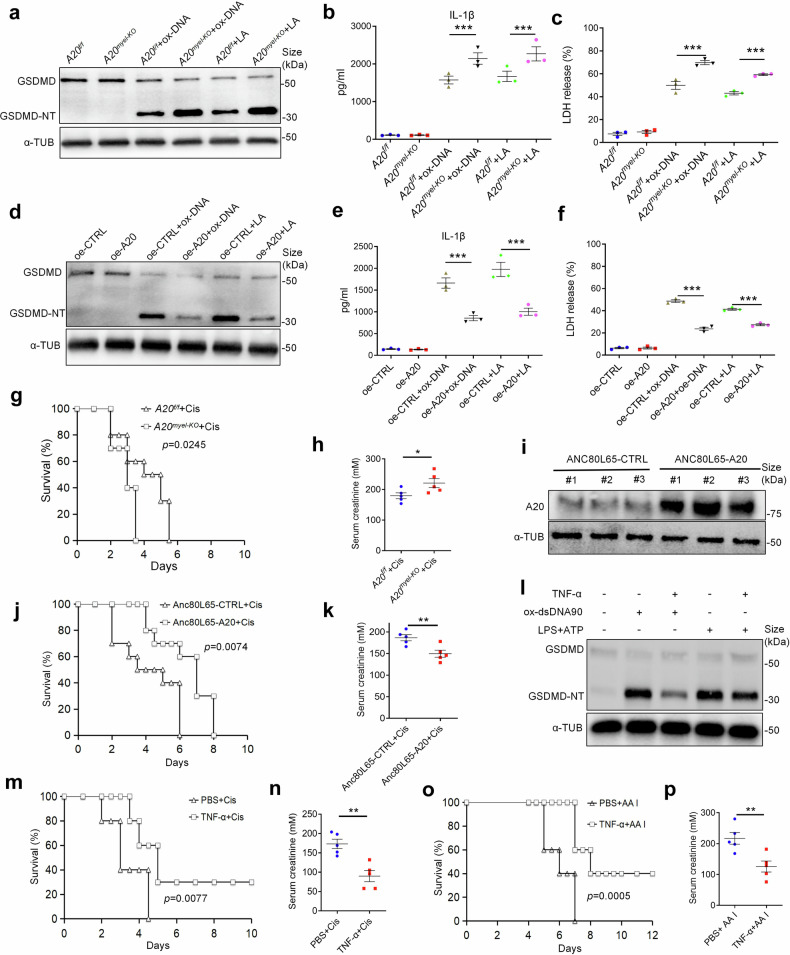
The ubiquitin-editing enzyme A20 is known to regulate inflammation and maintain homeostasis, but its role in self-DNA-mediated inflammation in acute kidney injury (AKI) is not well understood. Here, our study demonstrated that oxidized self-DNA accumulates in the serum of AKI mice and patients. This oxidized self-DNA exacerbates the progression of AKI by activating the cGAS-STING pathway and NLRP3 inflammasome. While inhibition of the STING pathway only slightly attenuates AKI progression, suppression of NLRP3 inflammasome-mediated pyroptosis significantly alleviates AKI progression and improves the survival of AKI mice. Subsequently, we found that Tnfaip3 (encoding A20) is significantly upregulated following oxidized self-DNA treatment. A20 significantly alleviates AKI development by dampening STING signaling pathway and NLRP3-mediated pyroptosis. Moreover, A20-derived peptide (P-II) also significantly alleviates ox-dsDNA-induced pyroptosis and improves the survival and renal injury of AKI mice. Mechanistically, A20 competitively binds with NEK7 and thus inhibiting NLRP3 inflammasome. A20 and P-II interfere with the interaction between NEK7 and NLRP3 through Lys140 of NEK7. Mutation of Lys140 effects on the interaction of NEK7 with A20 and/or NLRP3 complex. Conditional knockout of NEK7 in macrophages or pharmacological inhibition of NEK7 both significantly rescue AKI mouse models. This study reveals a new mechanism by which A20 attenuates oxidized self-DNA-mediated inflammation and provides a new therapeutic strategy for AKI.


Conflict of interest statement

Competing interests: The authors declare no competing interests.

Figures

Fig. 1
Fig. 1
Self-DNA is oxidized and released in AKI. a Serum DNA value of healthy donors and active sepsis patients. (n = 9, mean ± SEM); ***P < 0.001. b Serum DNA values of mice treated with PBS, Cis, AA I, or LPS. (n = 5, mean ± SEM); ***P < 0.001. c Fluorescence microscopy of 8OH-dG (red) in kidneys of mice that were treated with PBS, Cis, AA I, or LPS (n = 3). scale bars, 10 μm. Schematic of genomic DNA isolation of renal tissue from mice that were intraperitoneally injected with cisplatin (d) (named Cis-DNA), AA I (e) (AA-DNA) or LPS (f) (LPS-DNA), and the specific time of implementing isolation was indicated in timeline. g 8OH-dG concentrations in DNA extracted from renal tissue of PBS, Cis, AA I, and LPS treated mice (n = 3, mean ± SEM); *P < 0.05, **P < 0.01, ***P < 0.001. h Fluorescence microscopy of DAPI (blue), 8OH-dG (green), and F4/80 (red) in kidneys of mice treated with Cis (n = 3). scale bars, 10 μm. i Fluorescence microscopy of DAPI (blue), 8OH-dG (green), and F4/80 (red) in kidneys of mice treated with LPS (n = 3). scale bars, 10 μm
Fig. 2
Fig. 2
Ox-self-DNA promotes the progression of AKI by activating STING signaling pathway. a Immunoblotting showing expression levels of indicated proteins in BMDMs treated with PBS, PBS-DNA, Cis-DNA, or AA-DNA. Quantitative PCR analysis of Cxcl10 (b) and Ifn-β (c) mRNA in BMDMs treated with PBS, PBS-DNA, Cis-DNA, or AA-DNA. The expression of Gapdh mRNA was used to normalize the results. (n = 3, mean ± SEM); ***P < 0.001. d, e CXCL10 (d) and IFN-β (e) levels from supernatants of BMDMs stimulated with PBS, PBS-DNA, Cis-DNA, or AA-DNA. (n = 3. mean ± SEM); ***P < 0.001. Expression levels of serum CXCL10 (f) and IFN-β (g) in WT and Sting−/− mice intraperitoneally injected with PBS, Cis, or AA I were measured by ELISA. (n = 5, mean ± SEM); ***P < 0.001. h Survival of WT mice and Sting−/− mice intraperitoneally injected with Cis. (n = 10 per group). i Serum creatinine level of mice as described in (h). (n = 5. mean ± SEM); **P < 0.01. j Survival of WT mice and Sting−/− mice intraperitoneally injected with AA I. (n = 10 per group). k Serum creatinine level of mice as described in (j). (n = 5. mean ± SEM); *P < 0.05. l Survival of Cis plus PBS or Cis plus DNase I treated mice. (n = 10 per group). m Serum creatinine level of mice as described in (l). (n = 5. mean ± SEM); ***P < 0.001. n Survival of AA I plus PBS or AA I plus DNase I treated mice. (n = 10 per group). o Serum creatinine level of mice as described in (n) (n = 5. mean ± SEM); ***P < 0.001. p Serum level of IL-1β in mice with pharmaceutical employment as described in (l, n). (n = 5, mean ± SEM); ***P < 0.001
Fig. 3
Fig. 3
Ox-self-DNA promotes the progression of AKI by facilitating pyroptosis. a Immunoblots for total and cleaved caspase-3, MLKL, and phosphorylated MLKL, total and cleaved GSDMD from BMDMs treated with PBS, PBS-DNA, Cis-DNA, or AA-DNA. IL-1β level of supernatant from BMDMs treated with PBS, PBS-DNA, Cis-DNA, or AA-DNA was analyzed by ELISA (b), with cell death determined by LDH release (c), (n = 3, mean ± SEM); ***P < 0.001. d Survival of mice injected with Cis plus PBS or Cis plus disulfiram (n = 10 per group). e Serum creatinine level of mice as described in d. (n = 5. mean ± SEM); **P < 0.01. f Survival of mice injected with AA I plus PBS or AA I plus disulfiram (n = 10 per group). g Serum creatinine level of mice as described in (f). (n = 5. mean ± SEM); *P < 0.05. h Immunoblots for NEK7 from BMDMs treated with PBS or various DNA. i Immunoblots for total and cleaved GSDMD from iBMDMs treated with PBS-DNA or AA-DNA with or without MCC950 treatment. j Survival of mice treated with Cis and intraperitoneally preinjected with PBS or MCC950 (n = 10 per group). k Serum creatinine level of mice as described in (j). (n = 5. mean ± SEM); *P < 0.05. l Survival of mice treated with AA I and intraperitoneally preinjected with PBS or MCC950 (n = 10 per group). m Serum creatinine level of mice as described in (l). (n = 5. mean ± SEM); **P < 0.01
Fig. 4
Fig. 4
A20 is a key molecule in response to ox-DNA. RNA-Seq was performed on mRNA isolated from ox-dsDNA90- or CDNs-treated BMDMs. a, d Kyoto Encyclopedia of Genes and Genomes (KEGG) pathway analysis demonstrated the upregulated pathways. Heatmaps of differentially expressed genes reactive to ox-dsDNA90 (b) or CDNs (e) stimulation. Volcano Plot of differential gene expression of ox-dsDNA90- (c) or CDNs- (f) treated BMDMs. Immunoblots for A20 from iBMDMs respectively treated with ox-dsDNA90 (g), LPS-DNA (h) or CDNs (i). j Quantitative PCR analysis of Tnfaip3 mRNA in iBMDMs treated with PBS, BAY11-7082 (1 μM), C-176 (1 μM), ox-dsDNA90, ox-dsDNA90 along with BAY11-7082 (1 μM, 4 h pretreated before ox-dsDNA90 stimulation) or ox-dsDNA90 along with C-176 (1 μM, 24 h pretreated before ox-dsDNA90 stimulation). (n = 3. mean ± SEM); **P < 0.01, ***P < 0.001. k Quantitative PCR analysis of Tnfaip3 mRNA in iBMDMs treated with indicated reagents. (n = 3, mean ± SEM); ***P < 0.001. l Immunoblots for A20, NF-κB-p65, and phosphorylated NF-κB-p65 from iBMDMs treated as described in (j)
Fig. 5
Fig. 5
A20 inhibits STING activation. a Immunoblots for STAT1 and phosphorylated STAT1, TBK1 and phosphorylated TBK1, IRF3 and phosphorylated IRF3 from A20f/f BMDMs and A20myel-KO BMDMs with or without ox-dsDNA90 treatment. Quantitative PCR analysis of Cxcl10 (b) and Ifn-β (c) mRNA in BMDMs isolated from A20f/f BMDMs and A20myel-KO BMDMs with or without treatment with ox-dsDNA90. (n = 3, mean ± SEM); ***P < 0.001. CXCL10 (d) and IFN-β (e) ELISA of supernatant from BMDMs as described in (a). (n = 3, mean ± SEM); **P < 0.01, ***P < 0.001. f Immunoblots for STAT1 and phosphorylated STAT1, TBK1, and phosphorylated TBK1, IRF3 and phosphorylated IRF3 from BMDMs infected with lentivirus encoding green fluorescent protein (GFP) (oe-CTRL) or mouse A20/GFP (oe-A20) with or without ox-dsDNA90 treatment. Quantitative PCR analysis of Cxcl10 (g) and Ifn-β (h) mRNA in oe-CTRL iBMDMs and oe-A20 iBMDMs with or without treatment with ox-dsDNA90. (n = 3, mean ± SEM); ***P < 0.001. CXCL10 (i) and IFN-β (j) ELISA of supernatant from oe-CTRL iBMDMs or oe-A20 iBMDMs treated as indicated in (c). (n = 3, mean ± SEM); **P < 0.01, ***P < 0.001
Fig. 6
Fig. 6
A20 inhibits ox-DNA-induced pyroptosis and limits the progression of AKI. a BMDMs was isolated from A20f/f or A20myel-KO mice and then stimulated with PBS, ox-dsDNA90 (ox-DNA) or LPS plus ATP (LA). The total and cleaved GSDMD of these BMDMs were measured by immunoblotting. IL-1β (b) and LDH (c) levels from the supernatant of BMDMs as depicted in (a) were measured. (n = 3, mean ± SEM). ***P < 0.001. d Immunoblots for total and cleaved GSDMD from PBS, ox-dsDNA90 or LPS followed by ATP stimulated oe-CTRL iBMDMs or oe-A20 iBMDMs. IL-1β (e) level from the supernatant of iBMDMs as described in (d) were measured by ELISA, and cell death was determined by LDH (f). (n = 3, mean ± SEM). ***P < 0.001. g Survival of Cis treated A20f/f or A20myel-KO mice. (n = 10 per group). h Serum creatinine of Cis-treated A20f/f or A20myel-KO mice. (n = 5, mean ± SEM). *P < 0.05. i Immunoblots for A20 from renal tissue of mice treated with Anc80L65-CTRL or Anc80L65-A20 (# indicates the serial number of individual mouse). j Survival of mice treated with Anc80L65-CTRL plus Cis or Anc80L65-A20 plus Cis. (n = 10 per group). k Serum creatinine of mice as depicted in (j). (n = 5, mean ± SEM). **P < 0.01. l Immunoblots for total and cleaved GSDMD from BMDMs stimulated with PBS, ox-dsDNA90, or LPS followed by ATP with or without pretreatment of TNF-α. m Survival of mice treated with Cis, with or without pretreatment of TNF-α. (n = 10 per group). n Serum creatinine of mice as depicted in (m). (n = 5, mean ± SEM). **P < 0.01. o Survival of mice treated with AA I, with or without pretreatment of TNF-α. (n = 10 per group). p Serum creatinine of mice as depicted in (o). (n = 5, mean ± SEM). **P < 0.01
Fig. 7
Fig. 7
A20 binds with NEK7 and impedes the interaction of NEK7 and NLRP3. a HEK293T were transiently transfected with FLAG-A20 plasmids and indicated NEK7 associated/derived plasmids, including WT-NEK7 and individual mutation of K293 of NEK7. The protein level of FLAG-A20 in immunoprecipitates of NEK7 was detected by immunoblotting. b The predicted structure of NEK7 (light gray) and peptide P-II (orchid). Coordinates of Lys130, Leu132 and Lys140 (gold) of NEK7 interact with Val3, Leu5 and Gly11 of peptide, respectively. Dashed lines indicate hydrogen bonds. c HEK293T were transiently transfected with indicated HA-NEK7 associated/derived plasmids, including WT, individual mutation of K130, L132 or K140, and simultaneous mutation of K130, L132, and K140. The protein level of HA-NEK7 in immunoprecipitates of biotin-P-II was detected by immunoblotting. Abbreviation: Tri-MUT is a triple mutation. d P-II were dissolved with ddH2O and diluted into the indicated concentration. HA-WT-NEK7 or HA-Tri-MUT-NEK7 plasmids were transfected into HEK293T and purified by immunoprecipitation. The kinetic interaction of NEK7 and P-II was detected by BLI analysis. Fitting curve was shown as a dotted line. e, f HEK293T were transiently transfected with FLAG-A20 and indicated HA-NEK7 associated/derived plasmids. The protein level of FLAG-A20 in immunoprecipitates of HA-NEK7 was detected by immunoblotting. g FLAG-A20, NLRP3, and indicated plasmids of HA-NEK7 were transiently transfected into HEK293T. Immunoprecipitates were immunoblotted with the indicated antibodies
Fig. 8
Fig. 8
Targeting NEK7 can alleviate acute kidney injury. NEK7 knockout efficiency of myeloid cells from Nek7f/f or Nek7myel-KO mice were detected by quantitative PCR analysis (a) and immunoblotting (b). c Survival curves of the Nek7f/f or Nek7myel-KO mice that treated with Cis. (n = 10 per group). d Serum creatinine of mice as depicted in (c). (n = 5, mean ± SEM). ***P < 0.001. e Representative images of HE staining of the renal tissue sections. Scale bar, 50 μm. (n = 5). f Histological analysis of tubular injury of renal tissue sections as described in (c). (n = 5, mean ± SEM); ***P < 0.001. g Representative images of Masson staining of the renal tissue sections. Scale bar, 50 μm. (n = 5). h Immunoblots for NEK7 from renal tissue of Cis-treated mice that underwent in vivo NEK7 knockdown by siRNA. (n = 3) (# indicates the serial number of the individual mouse). i Survival of Cis-treated siCTRL mice or siNEK7 mice (n = 10). j Serum creatinine of mice as described in i. (n = 5, mean ± SEM). **P < 0.01. k Representative images of HE staining of renal tissue sections from Cis-treated siCTRL mice or siNEK7 mice. Scale bar, 50 μm, (n = 9). l Histological analysis of tubular injury of renal tissue sections as described in (i). (n = 9, mean ± SEM); ***P < 0.001. m Representative images of Masson staining of the renal tissue sections. Scale bar, 50 μm. (n = 5). n Survival curves of the mice that treated with Cis or Cis plus 12 h pretreated A20-derived-peptide(15 mg/kg). (n = 10 per group). o Serum creatinine of mice as described in (n) (n = 5, mean ± SEM). ***P < 0.001. p Representative images of HE staining of renal tissue sections from mice that were treated with Cis or Cis plus 12 h pretreated A20-derived-peptide. Scale bar, 50 μm, (n = 9). q Histological analysis of tubular injury of renal tissue sections as described in (n). (n = 9, mean ± SEM); ***P < 0.001. r Representative images of Masson staining of the renal tissue sections. Scale bar, 50 μm. (n = 5)
Fig. 9
Fig. 9
Medicines targeting NEK7 alleviates the progression of AKI. a Immunoblots for NEK7 from iBMDMs treated with LPS or LPS plus metformin for 0 mM, 1 mM, 2 mM, or 5 mM. b Immunoblots for NEK7 from renal tissue of mice treated with PBS plus Cis or metformin plus Cis (# indicates the serial number of individual mouse). c Survival of Cis-treated mice or Cis plus metformin-24 h-pretreated mice (n = 10 per group). d Serum creatinine of mice as described in (c). (n = 5, mean ± SEM). ***P < 0.001. e Representative images of HE staining of renal tissue sections from mice treated with PBS plus Cis or metformin plus Cis. Scale bar, 50 μm. (n = 9). f Histological analysis of tubular injury of renal tissue sections as described in (c). (n = 5, mean ± SEM); ***P < 0.001. g Representative images of Masson staining of the renal tissue sections. Scale bar, 50 μm. (n = 5). h Survival of mice treated with PBS plus LPS or berberine plus LPS. (n = 10 per group). i Serum creatinine of mice as described in (h). (n = 5, mean ± SEM). ***P < 0.001. j Representative images of HE staining of the renal tissue sections from mice as described in (h). Scale bar, 50 μm. (n = 9). k Histological analysis of tubular injury of renal tissue sections as described in (h) (n = 9, mean ± SEM); ***P < 0.001. l Representative images of masson staining of the renal tissue sections. Scale bar, 50 μm. (n = 5)

References

    1. Kellum, J. A. et al. Acute kidney injury. Nat. Rev. Dis. Prim.7, 52 (2021). - PubMed
    1. Ronco, C., Bellomo, R. & Kellum, J. A. Acute kidney injury. Lancet394, 1949–1964 (2019). - PubMed
    1. Motwani, S. S. et al. Development and validation of a risk prediction model for acute kidney injury after the first course of cisplatin. J. Clin. Oncol.36, 682–688 (2018). - PMC - PubMed
    1. Pickkers, P. et al. Acute kidney injury in the critically ill: an updated review on pathophysiology and management. Intensive Care Med.47, 835–850 (2021). - PMC - PubMed
    1. Miao, N. et al. The cleavage of gasdermin D by caspase-11 promotes tubular epithelial cell pyroptosis and urinary IL-18 excretion in acute kidney injury. Kidney Int.96, 1105–1120 (2019). - PubMed

LinkOut - more resources