. 2025 Apr 25;16(1):3903.
doi: 10.1038/s41467-025-59339-4.

Single-cell RNA sequencing dissects the immunosuppressive signatures in Helicobacter pylori-infected human gastric ecosystem

Affiliations

Single-cell RNA sequencing dissects the immunosuppressive signatures in Helicobacter pylori-infected human gastric ecosystem

Wei Hu et al. Nat Commun. .

Abstract

Helicobacter pylori (H. pylori) manipulates the host immune system to establish a persistent colonization, posing a serious threat to human health, but the mechanisms remain poorly understood. Here we integrate single-cell RNA sequencing and TCR profiling for analyzing 187,192 cells from 11 H. pylori-negative and 12 H. pylori-positive individuals to describe the human gastric ecosystem reprogrammed by H. pylori infection, as manifested by impaired antigen presentation and phagocytosis function. We further delineate a monocyte-to-C1QC+ macrophage differentiation trajectory driven by H. pylori infection, while T cell responses exhibit broad functional impairment and hyporesponsiveness with restricted clonal expansion capacity. We also identify an HLA-DRs- and CTLA4-expressing T cell population residing in H. pylori-inhabited stomach that potentially contribute to immune evasion. Together, our findings provide single-cell resolution information into the immunosuppressive microenvironment shaped by H. pylori infection, offering critical insights for developing novel therapeutic approaches to eliminate this globally prevalent pathogen.


Conflict of interest statement

Competing interests: The authors declare no competing interests.

Figures

Fig. 1
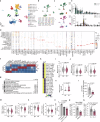
Fig. 1. Cohort characteristics and single cell profiling of human gastric ecosystem reprogrammed by H. pylori infection.
a Workflow representing the process of sample collection, single cell dissociation, separation, and scRNA-seq using the 10× platform. b Uniform Manifold Approximation and Projection (UMAP) plot showing the annotation and color codes for major cell types in H. pylori-negative or H. pylori-positive human Peripheral blood mononuclear cell (PBMC) or gastric ecosystem. c UMAP plots showing the cell origin from NP (n = 10), NT (n = 11), PP (n = 7) or PT (n = 11) samples. d Histogram showing the proportion of major cell types in each analyzed subject. e The expression of marker genes in the annotated cell types are showed by bubble heatmap. Dot size indicates fraction of expressing cells, colored based on normalized expression levels. f Boxplots showing the proportion of each major cell clusters in PBMC (Left, NP = 10, PP = 7) or gastric tissue (Right, NT = 11, PT = 11) samples. Quantitative data are shown as Mean ± SD. P values are calculated using the two-sided Wilcoxon rank sum test, and are shown in the figure panels. Source data are provided as a Source Data file. *p < 0.05; **p < 0.01; ***p < 0.001; ****p < 0.0001.
Fig. 2
Fig. 2. Repressed antigen processing and presentation capacities of H. pylori-infected antigen-presenting cells (APCs).
ac UMAP plot showing 16 subsets in myeloid lineage derived from H. pylori-negative or -positive individuals. a Each subcluster is color-coded according to cell type. b, c Cell origins are shown by (b) patient origin, and (c) H. pylori-negative (Upper) or -positive origin (Down). d Bubble heatmap showing marker genes across all subclusters from myeloid lineage. Dot size indicates fraction of expressing cells, colored based on normalized expression levels. e Boxplots showing the proportion of each myeloid subset in PBMC (Upper, NP = 10, PP = 7) or gastric tissue (Down, NT = 11, PT = 11) samples. Quantitative data are shown as Mean ± SD. P values are calculated using the two-sided Wilcoxon rank sum test, and are shown in the figure panels. f Heatmap showing the elevated genes expression (scaled mean expression) in each “classical” monocyte cluster. Colored based on normalized expression levels. g Up-regulated pathways in Cluster 7 by GO enrichment analysis. h Heatmap showing the top 10 activated transcriptional factors (TFs) for PBMC-derived Cluster 7 with or without H. pylori infection by SCENIC analysis. i Violin plot showing the MHC-II scores of CD14++CD16- monocytes from NP or PP samples. Violin outline width represents density. Horizontal line represents median. The p value is calculated using the two-sided Wilcoxon rank sum test, and is shown in the figure panels. j Violin plots showing the MHC-II scores of CD14+CD16+ (Left), or Mono 4 (Right) monocytes from NP or PP samples. Violin outline width represents density. Horizontal line represents median. P values are calculated using the two-sided Wilcoxon rank sum test, and are shown in the figure panels. k Violin plot showing the MHC-II scores of Mono 3 monocytes from NT or PT samples. Violin outline width represents density. Horizontal line represents median. The p value is calculated using the two-sided Wilcoxon rank sum test, and is shown in the figure panels. l C57/BL6J mice were orally gavaged with BHI (n = 5) or H. pylori PMSS1 strain (n = 5) for two months. Mice peripheral blood was collected to enrich PBMCs. Single immune cells were gated and dead cells were excluded via FVS450 signal. Mice peripheric monocytes were defined by CD45+Ly6G-CD11b+CD172a+. Flow cytometry analysis was performed to detect the expression levels (Median fluorescence intensity, MFI) of I-A/I-E in mice peripheral monocytes. Quantitative data are shown as Mean ± SD. The p value is calculated using the two-tailed student’s unpaired t-test, and is shown in the figure panels. m Violin plots showing the MHC-II scores of CD1C+ DCs from PBMC (Left) or gastric tissue (Right) samples with or without H. pylori infection. Violin outline width represents density. Horizontal line represents median. P values are calculated using the two-sided Wilcoxon rank sum test, and are shown in the figure panels. n Violin plots showing the MHC-II scores of CLEC9A+ (Left) or CD1C-CD141- (Right) DCs from NP or PP samples. Violin outline width represents density. Horizontal line represents median. P values are calculated using the two-sided Wilcoxon rank sum test, and are shown in the figure panels. o DC2.4 cells were infected with H. pylori TN2GF4 or NCTC 11637 strains (MOI = 1:10) for three days. Single cells were gated and dead cells were excluded via FVS450 signal. DC cells were defined by CD45+CD11b+CD11c+. The expression (MFI) of I-A/I-E in DC cells were determined (n = 3 replicates for each group). Quantitative data are shown as Mean ± SD. P values are calculated using ordinary one-way ANOVA followed by Tukey’s multiple comparison tests with adjustments, and are shown in the figure panels. The statistical significance of the data was calculated from one of three independent experiments with similar results. p C57/BL6J mice were administrated with BHI (n = 5) or H. pylori PMSS1 strain (n = 5) for two months. PBMCs were isolated from the blood of BHI or PMSS1-treated mice and subjected for flow cytometry analysis. Single immune cells were gated and dead cells were excluded via FVS450 signal. Mice peripheric DCs were defined by CD45+Ly6G-CD11b+CD11c+. The expression levels (MFI) of I-A/I-E in mice peripheral DCs were determined. Quantitative data are shown as Mean ± SD. The p value is calculated using the two-tailed student’s unpaired t-test, and is shown in the figure panels. q Gastric biopsies from H. pylori-negative (n = 13) or -positive (n = 12) patients were collected to isolate immune cells, then subjected them for flow cytometry analysis. Single immune cells were gated and dead cells were excluded via Zombie-NIR signal. Human gastric DCs were defined by CD11b+CD11c+. The expression levels (MFI) of HLA-DR in human gastric DCs derived from H. pylori-negative (n = 13) or H. pylori-positive (n = 12) patients were determined. Quantitative data are shown as Mean ± SD. The p value is calculated using the two-tailed student’s unpaired t-test, and is shown in the figure panels. Source data are provided as a Source Data file. *p < 0.05; **p < 0.01; ***p < 0.001; ****p < 0.0001.
Fig. 3
Fig. 3. Macrophages developed from monocyte-like precursors exhibiting an immunosuppressive phenotype following H. pylori colonization.
a Volcano plot showing Differentially expressed genes (DEGs) between C1QC+ and IFIT1+ macrophages. P values are calculated by two-sided Wilcoxon’s rank-sum test and corrected using the Benjamini-Hochberg approach. Genes highlighted in indigo have log2 fold change > 1.0 and p value < 0.05. b Differential pathways enriched in C1QC+ or IFIT1+ macrophages by GSVA analysis. c Developmental trajectory of Cluster 7 and two macrophage subsets recruited from H. pylori-positive samples is inferred by Monocle 3. The UMAP is colored by inferred pseudotime. d Violin plots showing the MHC-II scores of C1QC+ macrophages from PBMC (Left) or gastric (Right) samples with or without H. pylori infection. Violin outline width represents density. Horizontal line represents median. P values are calculated using the two-sided Wilcoxon rank sum test, and are shown in the figure panels. e Violin plots showing the MHC-II scores of IFIT1+ macrophages from PBMC (Left) or gastric (Right) samples with or without H. pylori infection. Violin outline width represents density. Horizontal line represents median. P values are calculated using the two-sided Wilcoxon rank sum test, and are shown in the figure panels. f Violin plots showing the phagocytosis scores of C1QC+ (Left) or IFIT1+ (Right) macrophages from NT or PT samples. Violin outline width represents density. Horizontal line represents median. P values are calculated using the two-sided Wilcoxon rank sum test, and are shown in the figure panels. g BMDM cells were infected with H. pylori TN2GF4 or NCTC 11637 strains (MOI = 1:50) for three days. Single cells were gated and dead cells were excluded via FVS450 signal. Macrophages were defined by CD45+CD11b+F4/80+. The expression (MFI) of I-A/I-E in BMDM cells were determined by flow cytometry analysis (n = 3 replicates for each group). Quantitative data are shown as Mean ± SD. P values are calculated using ordinary one-way ANOVA followed by Tukey’s multiple comparison tests with adjustments, and are shown in the figure panels. h Gastric biopsies from H. pylori-negative (n = 13) or -positive (n = 12) patients were collected to isolate immune cells, then subjected them for flow cytometry analysis. Single immune cells were gated and dead cells were excluded via Zombie-NIR signal. Human gastric macrophages were defined by CD11b+CD11c-. The expression levels (MFI) of HLA-DR in human gastric macrophages derived from H. pylori-negative (n = 13) or -positive (n = 12) patients were determined. Quantitative data are shown as Mean ± SD. The p value is calculated using the two-tailed student’s unpaired t-test, and is shown in the figure panels. i THP-1 cells were incubated with phorbol-12-myristate 13-acetate (PMA, 100 ng/ml) for 48 h, then infected with H. pylori TN2GF4 strain (MOI = 1:50) for three days. Cells were incubated with fluorescent beads (green) for 6 h (MOI = 1:100). Representative images of fluorescent beads in THP-1 cells were shown (Left). Twenty visual fields of each group were randomly selected to count the number of fluorescent beads (Right). Quantitative data are shown as Mean ± SD. The p value is calculated using the two-tailed student’s unpaired t-test, and is shown in the figure panels. The statistical significance of the data (g, i) was calculated from one of three independent experiments with similar results. Source data are provided as a Source Data file. *p < 0.05; **p < 0.01; ***p < 0.001; ****p < 0.0001.
Fig. 4
Fig. 4. CD8+HLA-DR+CTLA4+ T cells exhibited immunosuppressive phenotypes upon H. pylori colonization.
a, b UMAP plots showing 19 subsets in CD8+ T cells derived from H. pylori-negative or -positive patients. a Each subcluster is color-coded according to cell type. b Cells from H. pylori-negative (Upper) or -positive (Down) patients are shown. c Boxplots showing the proportion of each CD8+ T cell subset in PBMC (Upper) or gastric tissue (Down) samples. Quantitative data are shown as Mean ± SD. P values are calculated using the two-sided Wilcoxon rank sum test, and are shown in the figure panels. d Heatmap indicating the expression (scaled mean expression) of selected gene sets in stomach-resident CD8+ T cell subsets (Cluster 2, 4, 12, 15), including naïve, resident, inhibitory, pre-dysfunction, cytotoxicity, co-stimulatory, and MHC-II-related gene signatures. Colored based on normalized expression levels. e Boxplot showing the fractions of CD8A+HLA-DRA+CTLA4+ cells in the CD8-12-HLA-DR subset derived from NT (n = 11) or PT (n = 11) samples. The dot represents one value from individual participants. Boxplots centered at the median with hinges at 1st and 3rd quartiles and whiskers drawn from hinges to the lowest and highest points within 1.5 interquartile range. The p value is calculated using the two-tailed student’s unpaired t-test, and is shown in the figure panels. f Volcano plot showing DEGs of CD8-12-HLA-DR subset between NT and PT samples. P values are calculated by two-sided Wilcoxon’s rank-sum test and corrected using the Benjamini-Hochberg approach. Genes highlighted in purple have log2 fold change > 1.0 and p value < 0.05. g Inferred developmental trajectory of stomach-resident CD8+ T cell subsets (Cluster 2, 4, 12, 15) from H. pylori-positive samples by RNA velocity. h Developmental trajectory of stomach-resident CD8+ T cell subsets (Cluster 2, 4, 12, 15) from H. pylori-positive samples inferred by Monocle 3. The UMAP is colored by inferred pseudotime. i (Left) UMAP plot showing common clones shared among the different color-coded CD8+ T cell subsets. The thickness of the connecting lines between subtypes represents the number of shard TCR clones. (Right) The number of TCRs shared by two clusters are calculated. The two colors in every bar represent the particular two clusters sharing TCRs. j (Left) Clonotype diversity of CD8+ T cells in NT (n = 11) or PT (n = 11) samples measured by Gini-Simpson index. (Right) Clonal expansion is measured by the fraction of clonal T cells from stomach-enriched CD8+ T cell populations in NT (n = 11) or PT (n = 11) samples. The dot represents one value from individual participants. Boxplots centered at the median with hinges at 1st and 3rd quartiles and whiskers drawn from hinges to the lowest and highest points within 1.5 interquartile range. P values are calculated by two-sided Wilcoxon rank sum test. Source data are provided as a Source Data file. *p < 0.05; **p < 0.01; ***p < 0.001; ****p < 0.0001.
Fig. 5
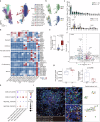
Fig. 5. Interaction between HLA-DR+CTLA4+ T cells and macrophages via the CTLA4/CD86 axis upon H. pylori infection.
a, b UMAP plots showing 16 subsets in CD4+ T cells derived from H. pylori-negative or -positive patients. a Each subcluster is color-coded according to cell type. b Cells from H. pylori-negative (Upper) or -positive (Down) patients are shown. c Boxplots showing the proportion of each CD4+ T cell subset in PBMC (Upper) or gastric tissue (Down) samples. Quantitative data are shown as Mean ± SD. P values are calculated using the two-sided Wilcoxon rank sum test, and are shown in the figure panels. d Heatmap indicating the expression (scaled mean expression) of selected gene sets in each CD4+ T cell subset, including naïve, resident, inhibitory, pre-dysfunction, cytotoxicity, co-stimulatory, and MHC-II-related gene signatures. Colored based on normalized expression levels. e Boxplot showing the fractions of CD4+HLA-DRA+CTLA4+ cells in the CD4-5-HLA-DR subset derived from NT (n = 11) or PT (n = 11) samples. The dot represents one value from individual participants. Boxplots centered at the median with hinges at 1st and 3rd quartiles and whiskers drawn from hinges to the lowest and highest points within 1.5 interquartile range. The p value is calculated using the two-tailed student’s unpaired t-test, and is shown in the figure panels. f Volcano plot showing DEGs of CD4-5-HLA-DR subset between NT and PT samples. P values are calculated by two-sided Wilcoxon’s rank-sum test and corrected using the Benjamini-Hochberg approach. Genes highlighted in purple have log2 fold change > 1.0 and p value < 0.05. g (Left) Clonotype diversity of CD4+ T cells in NT (n = 6) or PT (n = 11) samples measured by Gini-Simpson index. Samples (N5T, N7T, N8T, N9T and N10T) having fewer than 20 CD4+ T cells were excluded from analyzes. (Right) Clonal expansion is measured by the fraction of clonal T cells from stomach-enriched CD4+ T cell populations in NT (n = 11) or PT (n = 11) samples. The dot represents one value from individual participants. Boxplots centered at the median with hinges at 1st and 3rd quartiles and whiskers drawn from hinges to the lowest and highest points within 1.5 interquartile range. P values are calculated by two-sided Wilcoxon rank sum test (Left) or two-tailed student’s unpaired t-test (Right). h Bubble chart showing the interaction between macrophage and selected CD4+ or CD8+ T cell subsets, based on the L-R analysis. The scores are normalized expression levels, and the sizes of the bubbles indicate the significance of the interactions, calculated by CellPhoneDB. i Multiplexed immunofluorescence images showing the interaction between macrophages and CD4+ or CD8+ T cells that co-expressing HLA-DRA and CTLA4, based on the CTLA4/CD86 axis, using antibodies CD4, CD8, CD68, CD86, CTLA4, and HLA-DRA. Spatial distance between target cells is shown. Scale bars, 50 um. Data shown are representative images of six donors and one experiment. Source data are provided as a Source Data file. *p < 0.05; **p < 0.01; ***p < 0.001; ****p < 0.0001.

Similar articles

Cited by

References

    1. Malfertheiner, P. et al. Helicobacter pylori infection. Nat. Rev. Dis. Prim.9, 19 (2023). - PMC - PubMed
    1. Correa, P. A human model of gastric carcinogenesis. Cancer Res48, 3554–3560 (1988). - PubMed
    1. Tacconelli, E. et al. Discovery, research, and development of new antibiotics: the WHO priority list of antibiotic-resistant bacteria and tuberculosis. Lancet Infect. Dis.18, 318–327 (2018). - PubMed
    1. Sugano, K. et al. Kyoto global consensus report on Helicobacter pylori gastritis. Gut64, 1353–1367 (2015). - PMC - PubMed
    1. Jafarzadeh, A., Larussa, T., Nemati, M. & Jalapour, S. T cell subsets play an important role in the determination of the clinical outcome of Helicobacter pylori infection. Micro. Pathog.116, 227–236 (2018). - PubMed

MeSH terms