. 2025 Apr 25;8(1):664.
doi: 10.1038/s42003-025-08070-3.

Transcriptomic sex differences in early human fetal brain development

Affiliations

Transcriptomic sex differences in early human fetal brain development

Federica Buonocore et al. Commun Biol. .

Abstract

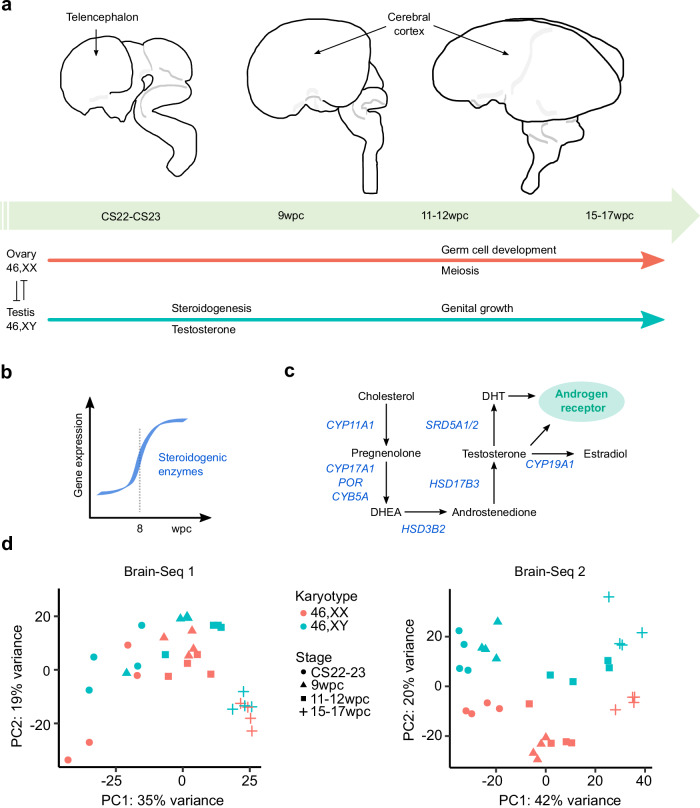
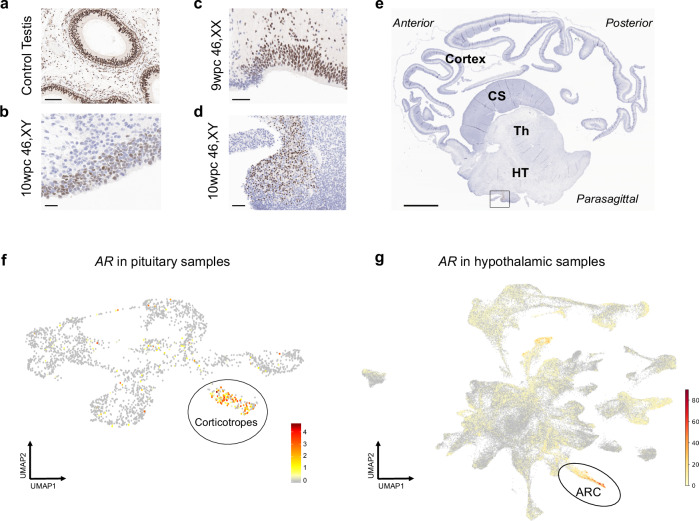
The influence of sex chromosomes and sex hormones on early human brain development is poorly understood. We therefore undertook transcriptomic analysis of 46,XY and 46,XX human brain cortex samples (n = 64) at four different time points between 7.5 and 17 weeks post conception (wpc), in two independent studies. This developmental period encompasses the onset of testicular testosterone secretion in the 46,XY fetus (8wpc). We show differences in sex chromosome gene expression including X-inactivation genes (XIST, TSIX) in 46,XX samples; core Y chromosome genes (n = 18) in 46,XY samples; and two Y chromosome brain specific genes, PCDH11Y and RP11-424G14.1. PCDH11Y (protocadherin11 Y-linked) regulates excitatory neurons; this gene is unique to humans and is implicated in language development. RP11-424G14.1 is a long non-coding RNA. Fewer differences in sex hormone pathway-related genes are seen. The androgen receptor (AR, NR3C4) shows cortex expression in both sexes, which decreases with age. Global cortical sex hormone effects are not seen, but more localized AR mechanisms may be important with time (e.g., hypothalamus). Taken together, our data suggest that limited but potentially important sex differences occur during early human fetal brain development.


Conflict of interest statement

Competing interests: The authors declare no competing interests.

Figures

Fig. 1
Fig. 1. Global sex differences during early brain development.
a Model of human brain development in relation to gonad development. Telencephalon and cerebral cortex regions of the developing brain are indicated by arrows. Gonad determination into either testis or ovary begins at around Carnegie Stage 18 (CS18) (6 weeks post conception, wpc). Testicular testosterone synthesis and secretion occurs from around CS23 (8wpc) in the 46,XY fetus. b Gene expression of factors implicated in testicular testosterone biosynthesis is upregulated at 8wpc. Data derived from del Valle et al.. c Simplified pathway of androgen biosynthesis with genes encoding enzymes showed in blue. DHEA, dehydroepiandrosterone; DHT, dihydrotestosterone. d Principal component analysis (PCA) for each independent bulk RNA-seq dataset (Brain-Seq 1, Brain-Seq 2) included in the study showing all samples (total n = 32 in each dataset, see Table 1) based on the first two principal components (PC1, PC2).
Fig. 2
Fig. 2. Global differential gene expression patterns between 46,XX and 46,XY samples during early brain development.
Two independent RNA-seq datasets were analyzed (Brain-Seq 1 and Brain-Seq 2), each containing n = 16 46,XX and n = 16 46,XY samples across all developmental stages (CS22-23; 9wpc; 11-12wpc; 15–17wpc) (Table 1). a, b Venn diagrams showing the overlap of differentially expressed genes (DEGs) in both RNA-seq datasets at all developmental stages. a All 46,XX samples; (b) All 46,XY samples; (c-d) Scatterplots of DEGs in Brain-Seq 1 and Brain-Seq 2. c All DEGs; d DEGs with adjusted p-values < 0.05. Black line and gray shading, weighted Deming regression and 95% confidence interval. Pearson correlation coefficients and adjusted p-values are indicated.
Fig. 3
Fig. 3. Volcano plots for differentially expressed genes between 46,XX and 46,XY samples at each developmental stage.
a Brain-Seq 1 dataset. b Brain-Seq 2 dataset. At each developmental stage there are n = 4 samples in the 46,XX group and n = 4 samples in the 46,XY group. Red indicates adjusted p-value < 0.001; purple indicates adjusted p-value < 0.01; blue indicates adjusted p-value < 0.05. The ten genes with the highest -log10 adjusted p-value in each group are labeled (where adjusted p-value < 0.001). CS Carnegie stage, wpc weeks post conception.
Fig. 4
Fig. 4. Sex-specific differential gene expression patterns during different stages of human brain development.
ad Venn diagrams showing the overlap of differentially expressed genes (DEGs) in both RNA-seq datasets at each developmental stage (CS22-23; 9wpc; 11-12wpc; 15–17wpc). a 46,XX Brain-Seq 1 dataset; (b) 46,XY Brain-Seq 1 dataset; (c) 46,XX Brain-Seq 2 dataset; (d) 46,XY Brain-Seq 2 dataset. Differential expression was defined as an adjusted p-value < 0.05. Those genes found to be shared across all four stages in each dataset were identified and then compared between the two datasets. e Common 46,XX differentially expressed genes in both datasets. f Common 46,XY differentially expressed genes in both datasets. CS Carnegie stage, wpc weeks post conception.
Fig. 5
Fig. 5. Analyses of brain-specific genes in 46,XY cortex.
a Venn diagram showing the overlap of 46,XY differentially expressed genes (DEGs) common to both brain datasets and several 46,XY independent control tissues. b Violin plots of normalized counts showing expression patterns of PCDH11Y across developmental stages in the 46,XX and 46,XY brain and in both datasets (n = 4 in each stage). c Log2 fold change (Log2FC) values of PCDH11Y in both brain datasets compared to controls across each developmental stage (n = 4 in each group); horizontal line represents the median value. Statistical analysis was performed using a one-way ANOVA with Dunnett’s multiple comparison tests; Brain-Seq 1 versus Controls, ****p-value < 0.0001; Brain-Seq 2 versus Controls, ****p-value < 0.0001. d qRT-PCR analysis of PCDH11Y in 46,XY brain cortex across key developmental stages, and compared to control. Two separate experiments were performed; in each, three independent samples were used for each stage, each done in triplicate. Four control tissues were used (kidney, liver, pancreas, skin). Representative data from one experiment is shown as mean with standard deviation. e Expression of PCDH11Y in the Human Protein Atlas Consensus dataset for adult brain, showing highest expression in cerebral cortex and hypothalamus, as well as in other brain structures (data accessed and downloaded from https://www.proteinatlas.org/ENSG00000099715-PCDH11Y/tissue). nTPM, normalized transcript per million. f Relative expression of PCDH11X and PCDH11Y in the Brain-Seq 1 and Brain-Seq 2 datasets (n = 4 in each group); data are shown as mean with standard deviation. CS Carnegie stage, wpc weeks post conception.
Fig. 6
Fig. 6. Expression of genes encoding the androgen receptor (AR) and related factors involved in dihydrotestosterone biosynthesis.
a Violin plots of normalized counts showing expression patterns of the AR in the Brain-Seq 1 dataset (n = 4 in each group) and (b) Brain-Seq 2 dataset. c Violin plots of normalized counts showing expression patterns of the SRD5A1, SRD5A2 and SRD5A3 enzyme-encoding genes in the Brain-Seq 1 dataset (n = 4 in each group) and (d) Brain-Seq 2 dataset. CS Carnegie stage, wpc weeks post conception.
Fig. 7
Fig. 7. Androgen receptor expression in the developing human brain.
a Immunohistochemistry (IHC) of nuclear androgen receptor expression in control prepubertal testis (epididymis) (scale bar 100 µm) and b in the 10 week post conception (wpc) cerebral cortex (46,XY) (scale bar 20 µm). c IHC of localized regions of androgen receptor expression in the 9wpc cortex (46,XX) and d in a hypothalamic region at 10wpc (46,XY) (scale bars 50 µm), indicated by the rectangle in e which shows the orientation of this localized androgen receptor staining in the 10wpc brain is indicated by the rectangle in a parasagittal section scale bar 2 mm. CS, corpus striatum/ganglionic eminence; HT, hypothalamus; Th, thalamus. f Single cell RNA-seq expression of androgen receptor (AR) in human pituitary samples (7–25wpc) (total n = 21; 46,XX n = 11; 46,XY n = 10). High expression of androgen receptor is shown in red in pituitary corticotropes (Supplementary Fig. 17). Data accessed from https://tanglab.shinyapps.io/Human_Fetal_Pituitary_Endocrine_Cells/ (CC BY 4.0, https://creativecommons.org/licenses/by/4.0/). g Single cell RNA-seq expression of androgen receptor (AR) in human hypothalamus samples (4–23wpc) (total n = 11; 46,XX n = 4; 46,XY n = 7). High expression of androgen receptor is shown in red in the arcuate nucleus (ARC) of the hypothalamus (Supplementary Fig. 18). Data accessed from https://nemoanalytics.org/p?l=a856c14e (CC BY-NC 4.0, https://creativecommons.org/licenses/by-nc/4.0/). UMAP, uniform manifold approximation and projection.

References

    1. de Vareilles, H., Rivière, D., Mangin, J. F. & Dubois, J. Development of cortical folds in the human brain: An attempt to review biological hypotheses, early neuroimaging investigations and functional correlates. Dev. Cogn. Neurosci.61, 101249 (2023). - PMC - PubMed
    1. Zhou, Y., Song, H. & Ming, G. Genetics of human brain development. Nat. Rev. Genet25, 26–45 (2024). - PMC - PubMed
    1. Herring, C. A. et al. Human prefrontal cortex gene regulatory dynamics from gestation to adulthood at single-cell resolution. Cell185, 4428–4447.e28 (2022). - PubMed
    1. Velmeshev, D. et al. Single-cell analysis of prenatal and postnatal human cortical development. Science382, eadf0834 (2023). - PMC - PubMed
    1. Sjöstedt, E. et al. An atlas of the protein-coding genes in the human, pig, and mouse brain. Science367, 1091–1097 (2020). - PubMed