. 2025 Apr 25;15(1):14506.
doi: 10.1038/s41598-025-98759-6.

Electrostatic solitary wave modeling in lunar wake plasma

Affiliations

Electrostatic solitary wave modeling in lunar wake plasma

Kuldeep Singh et al. Sci Rep. .

Abstract

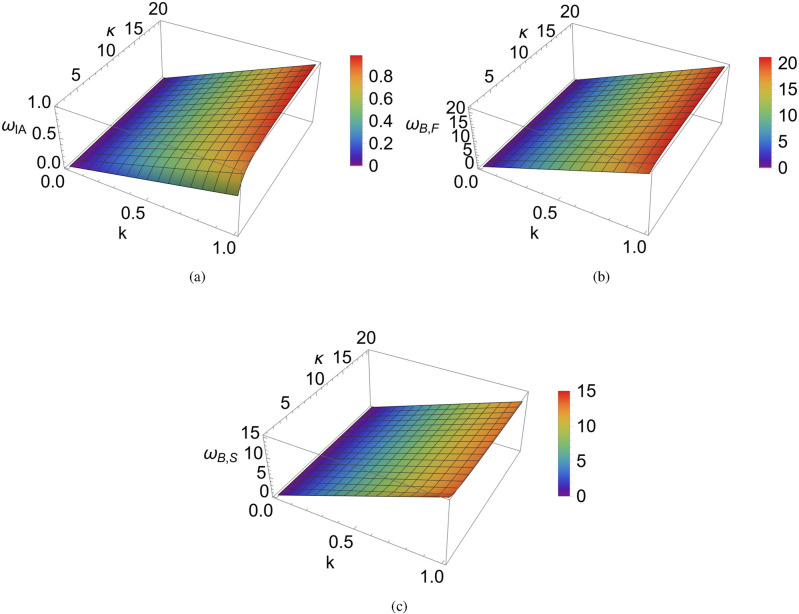
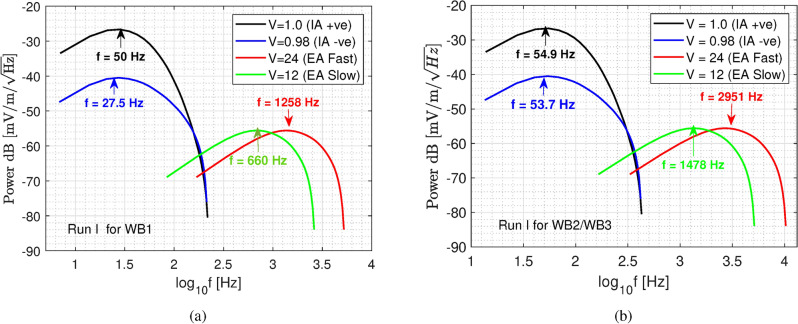
This investigation is inspired by the first flyby of NASA's ARTEMIS (Acceleration, Reconnection, Turbulence and Electrodynamics of the Moon's Interaction with the Sun) mission, which observed the signatures of electrostatics waves in the lunar wake region. We have developed a lunar plasma model consisting of protons, α-particles, an electron beam originating from the solar wind and suprathermal electrons. A pseudopotential technique has been employed to investigate the existence of electrostatic solitary waves from first principles. Due to the presence of the beam, three harmonic modes may be excited, namely an ion-acoustic mode and two distinct beam-driven electron-acoustic modes, with different phase speed (to be referred to as the fast and slow mode). The coexistence of positive and negative polarity structures associated with the ion-acoustic mode has been examined. Only negative polarity structures may occur in relation with the fast (supersonic) or the slow (subsonic) electron-acoustic modes. The combined effects of the beam and electron superthermality have been analyzed parametrically. The results of this investigation are in good agreement with observations of electrostatic waves reported in the lunar wake region. Our findings should help unfold the (mostly unexplored) dynamical characteristics of nonlinear waves observed in the lunar wake region.


Conflict of interest statement

Competing interests: The authors declare no competing interests.

Figures

Fig. 1
Fig. 1
Plot of the linear (angular) frequency (a) formula image of the ion-acoustic mode, (b) formula image of the fast electron-acoustic mode, and (c) formula image of the slow electron-acoustic mode, in the formula image plane. We have considered formula image, formula image, formula image, formula image, formula image, formula image, formula image and formula image in these plots.
Fig. 2
Fig. 2
Existence domain of solitary waves versus formula image for (a) the IA mode and for (b) the fast and slow EA modes. Here, the black curves represent the ion-acoustic mode, the blue curves are for the fast beam-driven electron acoustic mode and the red curves depict the slow electron acoustic mode. Note that the solid curve distinguishes the lower limit (formula image) from the upper limit (formula image) that is given by the dashed curve(s). We have considered formula image, formula image, formula image, formula image, formula image, formula image, formula image and formula image in these plots.
Fig. 3
Fig. 3
[Positive potential IA Solitary waves] Plots of (a) the Sagdeev pseudopotential, (b) the associated electrostatic potential pulse (formula image) and (c) the electric field (E) (bipolar pulse) profiles of ion-acoustic mode are presented versus the space coordinate formula image, for different values of formula image. We have considered formula image, formula image formula image, formula image, formula image, formula image, formula image, formula image and formula image in these plots. The zoomed-in view in panel-(a) on the negative axis shows no negative polarity solitary waves exist for given parameters.
Fig. 4
Fig. 4
[Coexistence of positive and negative polarity solitary waves] Plots of (a) Sagdeev pseudopotential, (b) associated electrostatic potential pulse (formula image) and (c) electric field (E) (bipolar pulse) profiles of ion-acoustic mode are depicted versus the space coordinate formula image, for different values of V and formula image. We have considered formula image, formula image, formula image, formula image, formula image, formula image, formula image and formula image in these plots.
Fig. 5
Fig. 5
[Fast electron-acoustic mode] Plot of (a) the Sagdeev pseudopotential, (b) the associated electrostatic potential pulse (formula image) and (c) electric field (E) (bipolar pulse) profiles for the fast electron-acoustic mode are depicted versus the space coordinate formula image, for various values of formula image. We have considered formula image, formula image, formula image, formula image, formula image, formula image, formula image, formula image and formula image in these plots.
Fig. 6
Fig. 6
[Slow electron-acoustic mode.] Plot of (a) the Sagdeev pseudopotential, (b) the associated electrostatic potential pulse (formula image) and (c) electric field (E) (bipolar pulse) profiles, for the slow electron-acoustic mode, are depicted versus the space coordinate formula image, for various values of formula image. We have considered formula image, formula image, formula image, formula image, formula image, formula image, formula image, formula image and formula image in these plots.
Fig. 7
Fig. 7
(a) Plot of the fast Fourier transform (FFT) power spectra of the electric field for WB1 corresponding to Run I for different values of V related to all three modes. Note that the value of kappa was fixed at formula image for both runs, based on the reported observations. The x-axis represents the logarithm logformula image, where f is the frequency (expressed in Hertz). The y-axis represents the power of the electric field expressed in decibel units (mV/m/formula image); (b) plot of the fast Fourier transform (FFT) power spectra of the electric field for WB2/WB3 corresponding to Run I. In the plots, we have taken formula image, formula image, formula image, formula image, formula image, formula image, formula image and formula image.
Fig. 8
Fig. 8
(a) Plot of the fast Fourier transform (FFT) power spectra of the electric field for WB1 corresponding to Run II, for different values of V related to all three modes. Note that the value of kappa is fixed to formula image for both runs, based on the observations. The x-axis represents the logarithm logformula image, where f is the frequency (expressed in Hertz). The y-axis represents the power of the electric field expressed in decibel units (mV/m/formula image); (b) plot of the fast Fourier transform (FFT) power spectra of the electric field for WB2/WB3 corresponding to Run II. We have taken formula image, formula image, formula image, formula image, formula image, formula image, formula image and formula image in these plots.

References

    1. Sagdeev, R. Z. Cooperative phenomena and shock waves in collisionless plasmas. In Reviews of Plasma Phys., Vol. 4 (ed. Leontovich, M. A.) 23–91 (Consultants Bureau, 1966).
    1. Washimi, H. & Taniuti, T. Propagation of ion-acoustic solitary waves of small amplitude. Phys. Rev. Lett.17, 992 (1966).
    1. Baboolal, S., Bharuthram, R. & Hellberg, M. A. Cut-off conditions and existence domains for large-amplitude ion-acoustic solitons and double layers in fluid plasmas. J. Plasma Phys.44, 1 (1990).
    1. Berthomier, M., Pottellete, R. & Malingre, M. Solitary waves and weak double layers in a two-electron temperature auroral plasma. J. Geophys. Res.103, 4261 (1998).
    1. Pickett, J. S. et al. Isolated electrostatic structures observed throughout the Cluster orbit: relationship to magnetic field strength. Ann. Geophys.22, 2515 (2004).

LinkOut - more resources