. 2025 Apr 25;8(1):225.
doi: 10.1038/s41746-025-01619-w.

Machine learning-based forecasting of daily acute ischemic stroke admissions using weather data

Affiliations

Machine learning-based forecasting of daily acute ischemic stroke admissions using weather data

Nandhini Santhanam et al. NPJ Digit Med. .

Abstract

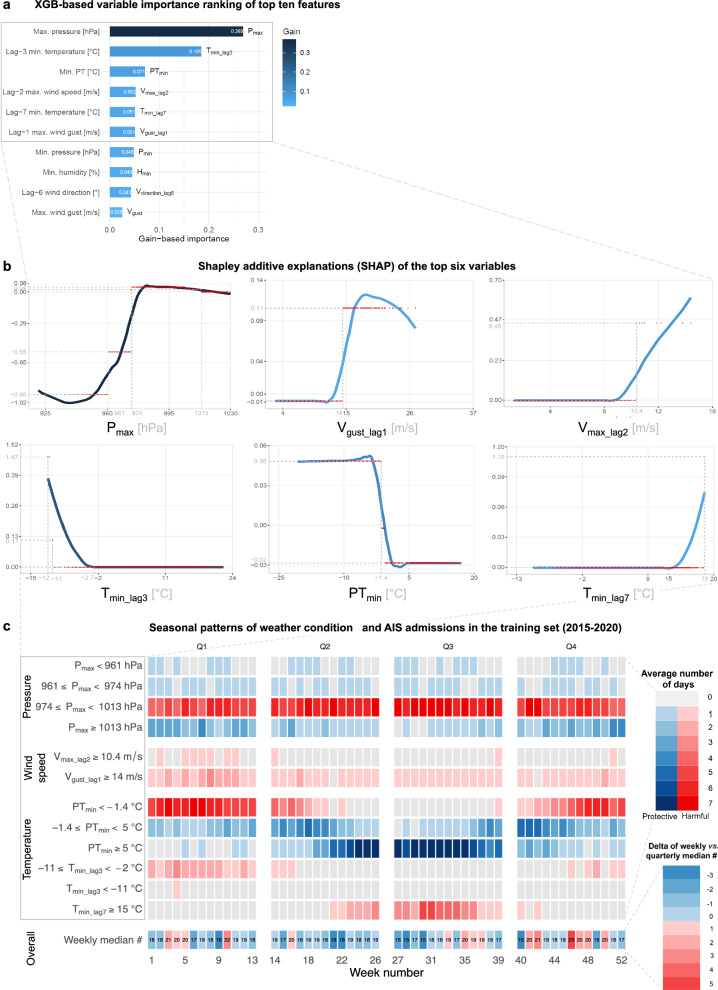
The climate crisis underscores the need for weather-based predictive analytics in healthcare, as weather factors contribute to ~11% of the global stroke burden. Therefore, we developed machine learning models using locoregional weather data to forecast daily acute ischemic stroke (AIS) admissions. An AIS cohort of 7914 patients admitted between 2015 and 2021 at the tertiary University Medical Center Mannheim, Germany, with a 600,000-population catchment area, was geospatially matched to German Weather Service data. Poisson regression, boosted generalized additive models, support vector machines, random forest, and extreme gradient boosting (XGB) were evaluated within a time-stratified nested cross-validation framework. XGB performed best (mean absolute error: 1.21 cases/day). Maximum air pressure was the top predictor, with temperature exhibiting a bimodal link. Cold and heat stressor days (Tmin_lag3 < -2 °C; Tperceived < -1.4 °C; Tmin_lag7 > 15 °C) and stormy conditions (wind gusts > 14 m/s) increased stroke admissions. This generalizable framework could aid real-time hospital planning, effective care and forecasting of various weather-related disease burdens.


Conflict of interest statement

Competing interests: M.E.M. reports unrelated consultancy to EppData GmbH and Siemens Healthineers GmbH, Germany. The remaining authors declare no competing interests. Ethics approval: This single-center retrospective cohort study entitled “Weather-based Stroke Event and Outcome Risk Modeling (WE-STORM)” was approved by the local use- and access- (UAC) and ethics committees (Medical Ethics Commission II, Medical Faculty Mannheim, Heidelberg University, approval nr.: 2022-800R-MA). All methods were carried out following institutional guidelines and regulations. The ethics committee waived written informed consent due to the retrospective nature of the analyses.

Figures

Fig. 1
Fig. 1. Setup for developing and benchmarking machine learning (ML) models to predict daily ischemic stroke admissions and their performance.
a Six years (2015–2020; n = 2190 days) constituted the training set, wherein 5 × 5-fold, time-stratified, nested cross-validation was performed to optimize hyperparameters of the benchmarked ML models. The optimized models were then applied to the hold-out test set (2021; n = 365 days) in a regression setting. The investigated ML models (horizontal facet panels) included both well-established statistical models like Poisson regression (baseline) and boosted generalized additive models (GAM) as well as shallow ML algorithms such as support vector regression (SVR), random forest (RF) and extreme gradient boosting (XGB). For each year (vertical facet panels), the daily number of observed (blue lines) and ML-predicted (red lines) AIS cases were smoothed for a two-week period. b Combination plot showing the histogram (top) of the observed number of AIS admission in the test set (2021), alongside the mean absolute error (MAE) of the respective ML model (center, blue shades). XGB outperformed all other models achieving near-zero MAE within the 2–4 cases range. c Box- and violin plots of residuals (predicted-observed) with mean (X¯) and median values, along with corresponding p-values (signif. in black) of pairwise Wilcoxon signed-rank tests (Ntests = 10) after Holm correction. XGB showed the widest distribution around 0 (X¯ = 0.28, median = 0). Although SVR had the lowest X¯ = 0.09 (median = 0.17), it produced a broader range of predictions, resulting in significantly lower MAE compared to Poisson (median = X¯ = 0.39, p = 2.2 × 10−16), GAM (X¯ = 0.23, median = 0.5, p = 1.1 × 10−8), RF (X¯ = 0.29, median = 0.49, p = 3.4 × 10−6) and XGB (p = 1.1 × 10−6). RF showed residuals similarly narrow to XGB (p = 0.24). Only XGB effectively learned the quantized prediction space of patient counts, while only Poisson predicted very rare days with >5 admissions (Supplementary Fig. 1c, d).
Fig. 2
Fig. 2. Combination figure of yearly, monthly, and weekly acute ischemic stroke admission (AIS) and their geospatial distribution.
a Yearly trend analysis of AIS case counts showed a pronounced increase from 2015 to 2017, resembling hype cycles, potentially attributable to landmark clinical trials for the endovascular treatment of AIS. In contrast, during the early COVID-19 pandemic (2020–2021), a clearly decreasing trend was observed. b Monthly AIS admissions (averaged over the 7-year study period; red line) indicated seasonal peaks in March, October, and November (95% CI in shaded gray) with min–max. ranges (dark blue dashed lines). c Weekly averages showed no apparent trends except for noticeable dips during the holiday season (50th-2nd weeks). d The University Medical Center Mannheim, Germany (UMC; formula image is located in the state of Baden–Wuerttemberg at (e) the corner of a German tri-state area (Rhineland Palatinate and Hesse; light blue bounding box). UMC is the primary tertiary care provider in Mannheim, the largest city in the region and the second largest in the state, with a population of 310,000 and a catchment area of over 600,000 people between Frankfurt (formula image) and Stuttgart. f Geospatial distribution highlighting the density of ischemic strokes per 100,000 population in the catchment area of UMC using the postal code-based distribution of patients’ home locations. The top three contributing areas were within an <11 km radius of the clinic and accounted for 29.2% of the total patient count, while 96.2% of all admissions arrived from a <50 km range. The selected weather stations are indicated with the icon (formula image).
Fig. 3
Fig. 3. The composite figure of detailed analyses of the most important predictors of the best performing XGB model and their link to seasonal distribution of daily AIS admissions.
a Horizontal bar chart of the top ten most relevant features using normalized gain-based variable importance ranking of the best XGB model. b Shapley additive explanations (SHAP) of the top six variables, including (upper-row) maximal air pressure (Pmax), lagged 1- and 2-days maximal wind speed (Vmax_lag2) and wind gust speeds (Vgust_lag1); and (lower-row) minimal lagged 3-days temperature (Tmin_lag3), minimal perceived temperature (PTmin), and 7-days minimum temperature (Tmin_lag7). These variables accounted for an overall sum of 0.84 gain-based importance out of the 133 investigated weather and calendar features. Inflection points on the subplots indicate (gray dashed lines) when the respective variable’s effect was associated with an increase or decrease in stroke counts. c Faceted heatmaps indicating the seasonal distributions of weather in the training data (2015–2020; n = 2190 days), thresholded using respective values from SHAP inflection points. The number of days that the respective condition has occurred was calculated by jointly aggregating at yearly and weekly levels (Supplementary Note 6. Aggregation methodology for the heatmap in Fig. 3, pp. 4). Protective (shades of blue) or harmful (red) median number of days were then color-coded based on the sign of the SHAP values. Additionally, the deltas of weekly stroke counts (aggregated over the seven years) were compared against the respective quarterly medians (lower right corner). Pmax showed a sigmoid-like link as low pressures (Pmax < 960 hPa) substantially decreased stroke admissions (SHAP = −0.95), while medium-high values (974–1013 hPa) were associated with an increased stroke incidence all year round (Q1–Q4). Cold stressor days (Q1, Q2, and Q4) and associated windy conditions (Vmax_lag210.4 m/s and Vgust_max_lag1 14 m/s) substantially increased admissions (SHAPVmax = 0.11 and SHAPVgust = 0.45). Similarly, extended cold stressor periods during winter with Tmin_lag3 < −2 °C or PTmin < −1.4 °C were strongly linked to more strokes (SHAP up to 1.47). Conversely, PTmin in classical temperate ranges (−1.4 < PTmin < 20 °C) were slightly protective (SHAP = −0.03), although these effects could be outweighed (SHAPTmin_lag7 = 1.18) during extended heat stress periods (Tmin_lag7 15°C) of the summer.

References

    1. Feigin, V. aleryL. et al. Global, regional, and national burden of stroke and its risk factors, 1990-2019: a systematic analysis for the Global Burden of Disease Study 2019. Lancet Neurol.20, 795–820 (2021). - PMC - PubMed
    1. Carlson, C. J. After millions of preventable deaths, climate change must be treated like a health emergency. Nat. Med.30, 622 (2024). - PubMed
    1. Romanello, M. et al. The 2023 report of the Lancet Countdown on health and climate change: the imperative for a health-centred response in a world facing irreversible harms. Lancet402, 2346–2394 (2023). - PMC - PubMed
    1. Flottmann, F. et al. Good clinical outcome decreases with number of retrieval attempts in stroke thrombectomy: beyond the first-pass effect. Stroke52, 482–490 (2021). - PMC - PubMed
    1. Chu, S. Y. et al. Temperature and precipitation associate with ischemic stroke outcomes in the United States. J. Am. Heart Assoc.7, e010020 (2018). - PMC - PubMed

LinkOut - more resources