. 2025 Apr 25;9(1):120.
doi: 10.1038/s41698-025-00818-8.

The dynamic immune behavior of primary and metastatic ovarian carcinoma

Affiliations

The dynamic immune behavior of primary and metastatic ovarian carcinoma

Elaine Stur et al. NPJ Precis Oncol. .

Abstract

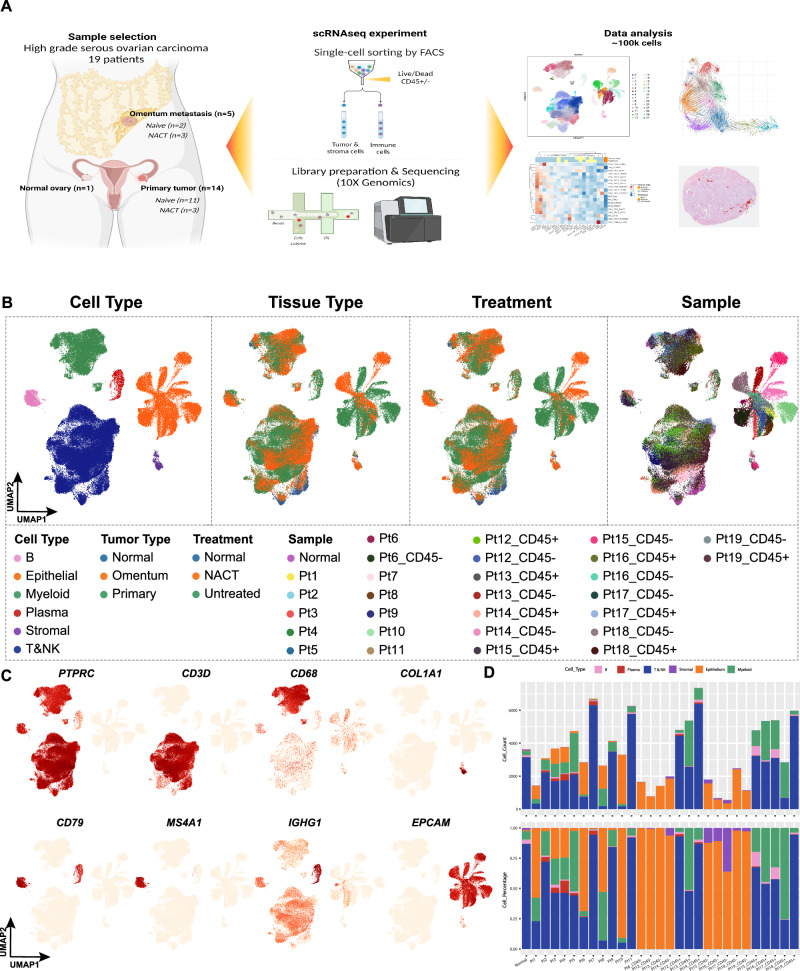
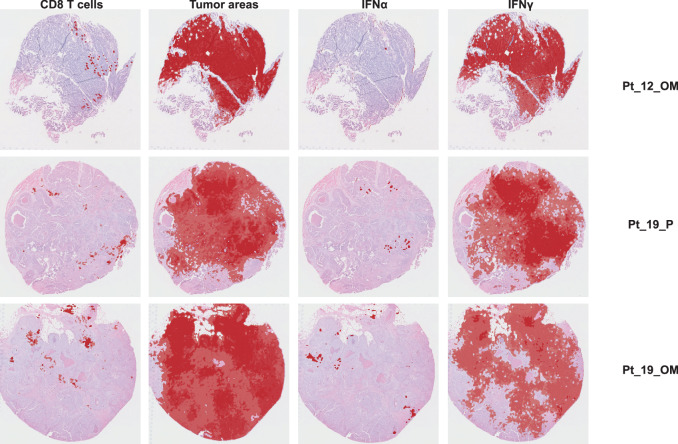
Patients with high-grade serous ovarian carcinoma (HGSC) are usually diagnosed with advanced-stage disease, and the tumors often have immunosuppressive characteristics. Together, these factors are important for disease progression, drug resistance, and mortality. In this study, we used a combination of single-cell sequencing and spatial transcriptomics to identify the molecular mechanisms that lead to immunosuppression in HGSC. Primary tumors consistently showed a more active immune microenvironment than did omental tumors. In addition, we found that untreated primary tumors were mostly populated by dysfunctional CD4 and CD8 T cells in later stages of differentiation; this, in turn, was correlated with expression changes in the interferon α and γ pathways in epithelial cells, showing that cross-communication between the epithelial and immune compartments is important for immune suppression in HGSC. These findings could have implications for the design of clinical trials with immune-modulating drugs.


Conflict of interest statement

Competing interests: A.K.S. is a consultant for Merck, GSK, Astra Zeneca, ImmunoGen, Iylon, Onxeo and DSMB for Advenchen and Mural Oncology. N.D.F. is a consultant for GlaxoSmithKline and Immunogen. S.P.S. reports research funding from AstraZeneca and Bristol Myers Squibb, outside the scope of this work; S.P.S. is a consultant and shareholder of Canexia Health Inc. The other authors declare no competing interests.

Figures

Fig. 1
Fig. 1. Schematic workflow and single-cell analysis of major cell types across HGSC specimens.
A Schematic workflow. A total of 19 freshly resected HGSC specimens were collected. Samples were processed using 10X genomic Chromium Single cell 3' v3. Created with BioRender.com using data contained elsewhere in the paper. B UMAP visualization of major cell types that were used for the subsequent analysis by cell type, tissue type, treatment, and tissue sample (patients). C UMAP visualization of the lineage canonical marker. D Cell count (up) and cell percentage (down) of the major cell types for each sample analyzed.
Fig. 2
Fig. 2. Characterization of epithelial cell heterogeneity across patients, tissue type, and treatments.
A UMAP visualization of epithelial cells by clusters and samples (patients). B CNV profiles using InferCNV to distinguish cancer cells from normal epithelial cells. The color-coded bars indicate sample, cluster, treatment, tissue type, and InferCNV prediction. C CNV profile of patient Pt_10 using InferCNV to distinguish subclusters of epithelial cells on the basis of their CNV characteristics. The color-coded bars indicate cluster (C1 and C2), treatment (untreated), and tissue type (primary). D UMAP visualization of C1 and C2 shows a clear distinction on the basis of CNV inference. E UMAP visualization of the CytoTrace score of patient Pt_10, showing C2 as a more differentiated cluster. F Pseudotime trajectory of the cancer cells from patient Pt_10. Pseudotime was colored in a gradient from dark to light blue. The start of pseudotime is indicated by dark blue and the end by light blue. ssGSEA of (G) omentum versus primary tumor tissues, H omentum versus primary treated tumor tissues, I primary untreated tumors versus primary NACT-treated tumors, and J NACT-treated versus untreated omentum tumors.
Fig. 3
Fig. 3. Immune cell composition, distribution, and correlation with survival across HGSC patient groups.
A UMAP of immune cells from all patients, distributed by cell type: B cells, T cells, natural killer cells (lymphoid cells), and myeloid cells. B Immune cell distribution across all patients. Top: immune cell type by group; Bottom: tissue distribution of immune cells by Ro/e analysis in different groups. C Immune cell proportion of each group of patients showed statistically significantly different proportions between groups. D Correlation between immune cell proportion and overall survival of patients with HGSC. E Ecotypes (relative abundance) of immune cell types by cancer type and treatment.
Fig. 4
Fig. 4. Differentiation trajectory and functional state of CD8 and CD4 T cells by treatment and tissue type.
Differentiation trajectory analysis of A CD8 T cells and B CD4 T cells projecting the expression of multiple cell types representing different stages of differentiation. Inference of T cell functionality based on gene expression modules for C T cell cytotoxicity, D T cell dysfunction, and E T-reg scores, showing clustering by tissue type and treatment.
Fig. 5
Fig. 5. Co-mapping of CD8 T cells, epithelial areas, and IFNα and γ pathways using spatial transcriptomics (Visium, 10X Genomics).
Representative tissue sections from three HGSC patients (Pt_12_OM, Pt_19_P, and Pt_19_OM), showing co-localization of CD8 T cells, tumor areas, and interferon signaling pathways (IFNα and IFNγ). Red areas indicate regions of high expression. Each row corresponds to a different patient sample, and each column displays the spatial distribution of one feature, demonstrating spatial relationships between immune infiltration, tumor regions, and interferon pathway activation.

References

    1. Matulonis, U. A. et al. Ovarian cancer. Nat. Rev. Dis. Prim.2, 16061 (2016). - PMC - PubMed
    1. Mullins, M. A. et al. Trends and racial disparities in aggressive end-of-life care for a national sample of women with ovarian. Cancer Cancer127, 2229–2237 (2021). - PMC - PubMed
    1. Coalition Woc. The World Ovarian Cancer Coalition atlas. The Every Woman Study 2018. https://worldovariancancercoalition.org/wp-content/uploads/2018/10/THE-W...) (2018).
    1. Lheureux, S., Braunstein, M. & Oza, A. M. Epithelial ovarian cancer: Evolution of management in the era of precision medicine. CA Cancer J. Clin.69, 280–304 (2019). - PubMed
    1. Berchuck, A. et al. Patterns of gene expression that characterize long-term survival in advanced stage serous ovarian cancers. Clin. Cancer Res.11, 3686–3696 (2005). - PubMed

LinkOut - more resources