. 2025 Sep;21(9):1433-1443.
doi: 10.1038/s41589-025-01895-3. Epub 2025 Apr 25.

Domain coupling in activation of a family C GPCR

Affiliations

Domain coupling in activation of a family C GPCR

Naomi R Latorraca et al. Nat Chem Biol. 2025 Sep.

Abstract

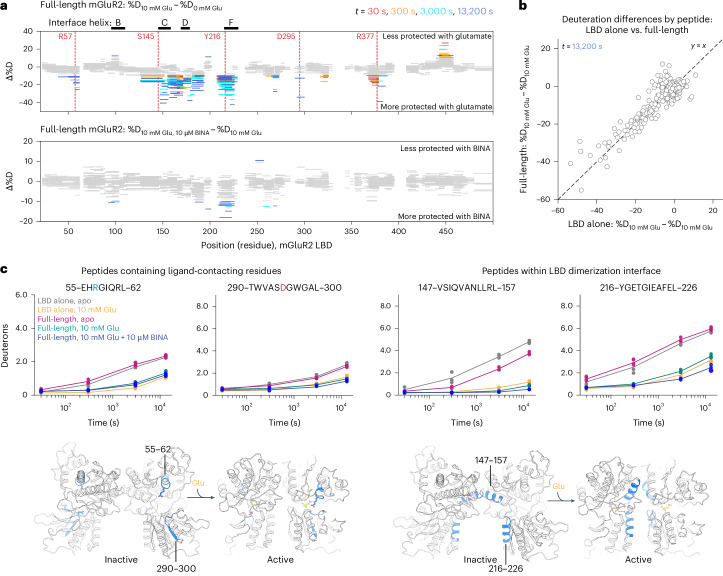
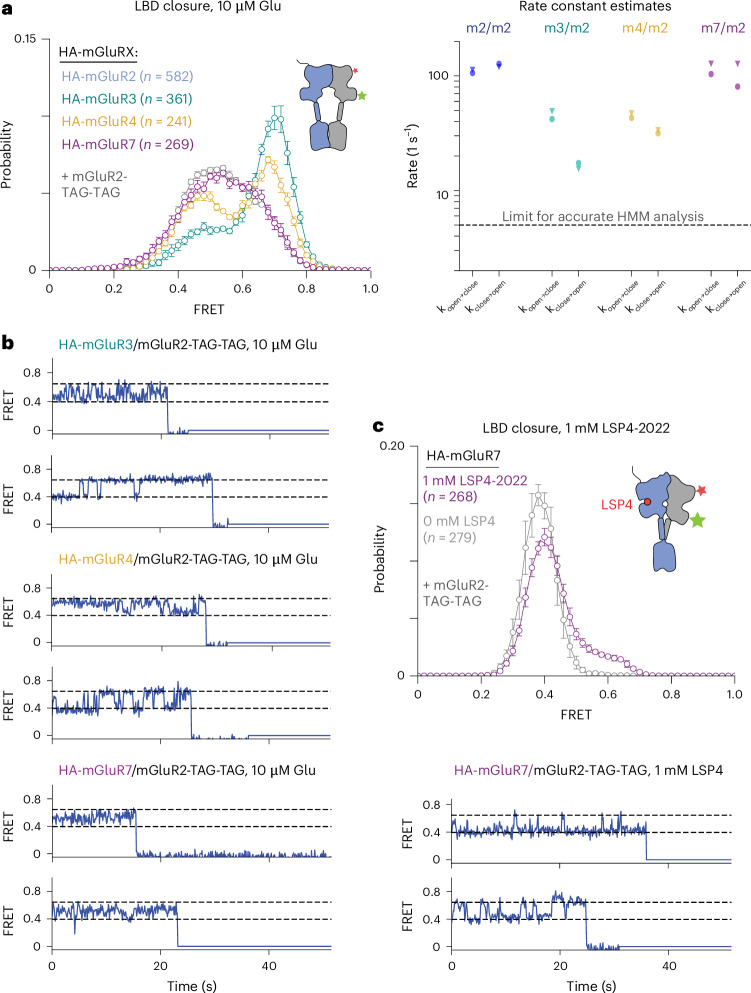
The G protein-coupled metabotropic glutamate receptors form homodimers and heterodimers with highly diverse responses to glutamate and varying physiological functions. We employ molecular dynamics, single-molecule spectroscopy and hydrogen-deuterium exchange to dissect the activation pathway triggered by glutamate. We find that activation entails multiple loosely coupled steps, including formation of an agonist-bound, pre-active intermediate whose transition to active conformations forms dimerization interface contacts that set efficacy. The agonist-bound receptor populates at least two additional intermediates en route to G protein-coupling conformations. Sequential transitions into these states act as 'gates', which attenuate the effects of glutamate. Thus, the agonist-bound receptor is remarkably dynamic, with low occupancy of G protein-coupling conformations, providing considerable headroom for modulation by allosteric ligands. Sequence variation within the dimerization interface, as well as altered conformational coupling in receptor heterodimers, may contribute to precise decoding of glutamate signals over broad spatial and temporal scales.


Conflict of interest statement

Competing interests: The authors declare no competing interests.

Figures

Fig. 1
Fig. 1. Agonist-induced LBD closure is loosely coupled to intersubunit activation of the extracellular domain.
a, Donor–acceptor pairs used to distinguish between intrasubunit LBD closure (left, middle-left) and intersubunit twisting (middle-right, right). For both pairs, adding agonist brings donor–acceptor pairs into closer proximity, thereby increasing the FRET signal. Detergent-solubilized receptors undergo stochastic labeling with donor and acceptor fluorophores via click chemistry, followed by low-density immobilization on a coverslip and single-molecule TIRF imaging. Analysis is limited to puncta with a single donor and a single acceptor. b, Single-molecule FRET traces for the two FRET pairs, carried out in the presence of EC50 (10 µM) and saturating (10 mM) levels of glutamate. c, smFRET histograms collected under a range of glutamate concentrations for each FRET pair. Bottom-right, 10 mM glutamate alone (black symbols) and along with 100 µM of the PAM BINA (orange); ≥4 movies per histogram; error bars represent s.e.m. The total number of traces for each condition is shown in the figure; the number of traces per movie is shown in Supplementary Table 1. Two additional biological replicates are shown in Extended Data Fig. 1. Source data
Fig. 2
Fig. 2. An electrostatic network controls the relaxed–twisted conformational transition.
a, Top: snapshots from an MD simulation, before and after the transition from an active, closed conformation to a relaxed, closed conformation. The distance between the upper and lower lobes of the LBD (or ‘clamshell’) is shown for each subunit; the distance between the lower lobe of each subunit increases to values seen in relaxed-state structures after the transition. Bottom: residues involved in cross-protomer interactions shown on structure of the mGluR2 LBD (left), and shown over time using gray bars (downsampled every 12 ns; right). b, smFRET to monitor intersubunit twisting reveals that R177A and D95A mutations reduce population of the high-FRET peak (left); data are presented as mean ± s.e.m.; four movies per histogram; total number of traces for each condition is shown in the figure. Percentage of high-FRET population in smFRET measurements of intersubunit twisting on additional polar residues at the dimer interface, determined by fitting histograms to sums of two Gaussians (right); data are mean ± s.e.m. across three to four biological replicates (number of traces analyzed per replicate shown in Supplementary Table 1). c, Top: snapshots from MD simulation with just the R177-containing helix shown demonstrate how a salt bridge breaks apart upon transition to the relaxed intermediate (top) and how, after this transition, helix D becomes less ordered (bottom). Ten frames per image, downsampled every 360 ns, before and after the transition. Bottom: a dimerization interface mutant, mGluR2-R177A, exhibits reduced clamshell closure in response to 10 mM glutamate (black) compared to wild-type (compare to Fig. 1c, bottom-left) or to mGluR2-R177A in the presence of high-affinity agonist LY379268 (purple); five movies per histogram; data are mean ± s.e.m. Total number of traces for each condition is shown in the figure. Source data
Fig. 3
Fig. 3. CRD linker acts as a brake on activation.
a, smFRET histograms across increasing concentrations of glutamate, as in Fig. 1, using the CRD twisting sensor. Data are presented as mean ± s.e.m.; four to five movies per histogram; total number of traces per histogram is shown in the figure; two additional biological replicates are shown in Extended Data Fig. 6. b, Proportion of each smFRET distribution occupying the higher of two FRET states, for either the lower-lobe reporter, shown in Fig. 1 (blue), or the CRD linker reporter (green); bimodal fit carried out on the mean FRET distribution across three biological replicates, with error bars corresponding to s.e.m. Dashed line indicates theoretical correction to the proportion of high-FRET particles for the LBD twist sensor (Methods). c, Forward-rate constants, reverse-rate constants and equilibrium constants estimated for three conditions (10 µM Glu, 10 mM Glu and 20 µM LY379268) for the LBD and CRD twisting sensors across four biological replicates (n = 4); *P < 0.05 estimated with Mann–Whitney U tests (one-sided; P = 0.015 in all cases). Number of traces analyzed per biological replicate shown in Supplementary Table 1. d, Addition of the PAM BINA (orange) on top of 10 mM Glu introduces a higher FRET peak at ~0.65, whereas addition of the inhibitory heterotrimeric G protein (Gi, blue) spreads to even higher FRET values; 0 mM glutamate (gray) and 10 mM glutamate (purple) are replotted smFRET distributions from a; data are presented as mean ± s.e.m.; ≥3 movies per histogram. e, Representative smFRET traces for each condition shown in c; idealizations (red lines) are Viterbi paths generated via HMM analysis applied to each condition using ebFRET. Source data
Fig. 4
Fig. 4. Ligand-induced modulation of LBD conformational dynamics.
a, Woods plots from HDX-MS experiments. Each horizontal bar corresponds to a peptide representing a fragment of the mGluR2 LBD sequence identified by mass spectrometry. The y position of each bar corresponds to the peptide’s change in % deuteration in the presence versus in the absence of 10 mM glutamate, such that negative values correspond to increased protection in 10 mM glutamate and positive values correspond to decreased protection in 10 mM glutamate (top). Bottom: change in deuteration in the presence versus absence of 10 µM BINA, added on top of 10 mM glutamate. Gray bars represent peptides showing ≤10% change in deuteration between the compared conditions. Colors represent the different exchange time points. Vertical, dashed red lines indicate ligand-contacting residues in the 4XAQ crystal structure. b, Scatter plot comparing deuteration differences for 10 mM Glu versus 0 mM Glu, for the same peptides monitored either in the LBD-alone construct or in the full-length mGluR2 construct at t = 13,200 s. c, Uptake plots highlighting changes in protection in regions of interest in the mGluR LBD—peptides 55–62 and 290–300 show distinct uptake patterns for glutamate-bound versus glutamate-free conditions. Peptides 147–157 differ between LBD-alone and full-length constructs in the absence of glutamate (compare gray versus pink). Peptides 216–226 demonstrate glutamate-dependent and BINA-dependent differences (compare pink versus turquoise versus blue). Dots correspond to average deuterium uptake for each peptide across three independent (n = 3) HDX-MS replicates. Source data
Fig. 5
Fig. 5. Differential population of mGluR2 LBD-closed states across mGluR heterodimers.
a, Left: FRET distributions in 10 µM clearly resolve open (low-FRET) and closed (high-FRET) peaks only in mGluR2/3 and mGluR2/4 heterodimers (data are presented as mean ± s.e.m.; four to six movies per histogram; additional biological replicates are shown in Extended Data Figs. 9 and 10). Right: rate constants for transitions between clamshell-open and clamshell-closed states determined using a subtemporal resolution inference method (Methods), on two biological replicates (triangles or circles). Dashed line is the upper limit for accurately inferring rate constants via an idealization-based approach (for example, HMM analysis), because beyond this point, there is a significant probability that a given time step will contain one or more transitions. b, Representative traces show distinct mGluR2 LBD open–closed kinetics with different partner subunits (10 fps). mGluR2/3 and mGluR2/4 display the longest-lived dwells in both LBD-open and closed states. c, In the presence of Group III–specific agonist LSP4-2022, ligand binding to the mGluR7 subunit induces some closure of unliganded mGluR2: histograms (top) and representative traces (bottom). Source data
Fig. 6
Fig. 6. Model for global activation of an mGluR homodimer.
a, smFRET data indicate that mGluR populates a series of discrete intermediates whose occupancy is affected by modulation of both the LBD and the TMD. States 1–3 correspond to inactive intermediates in which the LBD and CRD are relaxed with respect to each other. In states 4–6, the LBD adopts a twisted conformation, while CRDs differ in their proximity to one another. Gray bars indicate state occupancy under each ligand condition. b, Structural rendering of mGluR2 in its G protein-bound conformation—side chains highlighted in pink contribute to an intersubunit electrostatic network coordinated by R177; this network promotes LBD twisting. Helical region highlighted in blue undergoes additional protection in HDX-MS experiments upon binding of an allosteric modulator, providing a mechanism by which the TMD can modulate the LBD. c, Scatter plot of LBD–LBD (top) or TM6–TM6 (bottom) versus CRD–CRD distances across different full-length cryo-EM structures of mGluRs. A histogram of CRD–CRD distances reveals the heterogeneous spectrum of CRD–CRD distances observed across mGluR homodimers and heterodimers. Cα positions for Ala248 (mGluR2), Ala548 (mGluR2) or Phe756 (mGluR2), or the equivalent position in other mGluRs were used to determine LBD–LBD, CRD–CRD and TM6–TM6 distances, respectively. Source data
Extended Data Fig. 1
Extended Data Fig. 1. smFRET distributions for the clamshell and lower-lobe twisting sensors.
a,b, smFRET histograms, as displayed in Fig. 1, collected across a range of glutamate concentrations for the clamshell closure sensor (a) and the LBD lower lobe twisting sensor (b). Each column corresponds to histograms collected on a separate day (biological replicate). Data are presented as mean ± s.e.m. of ≥4 movies collected on the same day. c, Lower-lobe twisting sensor in the presence of 10 mM Glu and 100 µM BINA across three biological replicates; data are presented as mean ± s.e.m. of ≥4 movies. We also monitored LBD twisting in the presence of the Gi1 heterotrimer; due to limited reagents, we carried out one biological replicate (data are presented as mean ± s.e.m.; 4 movies per histogram). Source data
Extended Data Fig. 2
Extended Data Fig. 2. Representative smFRET traces for the closure and lower-lobe twisting sensors.
Representative smFRET traces. Donor (green) and acceptor (red) intensities (top) and FRET values (blue; bottom) for the LBD closure (left) and intersubunit twisting (right) FRET pairs. a,b, LBD closure in 10 μM glutamate (a) and 10 mM glutamate (b). c,d, Intersubunit twist in 10 μM glutamate (c) and 10 mM glutamate (d). Source data
Extended Data Fig. 3
Extended Data Fig. 3. Traces and interface interactions for additional simulations.
a, Simulations 1 and 3 show transitions to a relaxed, LBD-closed intermediate, and data for simulation 5, which also captures this transition, is represented in the main text Fig. 2. b, Analysis of angle changes during simulation—we measured the rotation of helix B (residues 95–108) in one subunit with respect to its orientation in the opposite subunit. In active structures and simulation snapshots, angles range between ~45° and 60° versus in intermediate simulation snapshots, where angles range between ~65° and 85°. Panels demonstrate two different views of the mGluR dimer. The leftmost structures, in surface representation, are rotated 90° counterclockwise to obtain the rightmost structures, in cartoon representation, which show a cutaway of the dimer interface. c, Changes in the flexibility of the R177-containing helix, before and after the transition (n = 3 simulations; data presented are mean ± s.e.m). RMSF analysis carried out on 2 µs pretransition and post-transition; average structure calculated from simulations 2 and 4, which do not transition away from initial state. P values calculated using two-sided t test (P values displayed for comparisons < 0.10: for chain A—K175 (P = 0.080); for chain B—D174 (P = 0.026); K175 (P = 0.014); S176 (P = 0.0012); R177 (P = 0.0019); Y178 (P = 0.0126). Source data
Extended Data Fig. 4
Extended Data Fig. 4. Comparison to structures of mGluR5 determined via cryo-EM.
a, The cryo-EM-captured mGluR5 intermediate and the MD-determined mGluR2 intermediate both exhibit two closed LBDs with substantial separation between their lower lobes (≥50 Å). Clamshell distances, Cα–Cα distance between residues 144 and 272 (mGluR2) or residues 151 and 280 (mGluR5). LBD distance, distance between the center of mass of either chain (residues 188–317, 452–474 for mGluR2 or residues 195–32, 465–487 for mGluR5). b, Contact matrices for mGluR5 and mGluR2 structures reveal conformation–specific patterns. In the R-O/O conformation (inactive), helices B and C form numerous self-contacts across the interface, while in the A-C/C conformation (active), helices B and C form numerous cross-interface interactions (off-diagonal elements). The mGluR2 and mGluR5 intermediates are similar in that cross-protomer contact between helices B and C is minimal but differ in the degree to which one subunit has fully rotated with respect to the other, giving rise to the asymmetry in the mGluR2 intermediate contact matrix. Source data
Extended Data Fig. 5
Extended Data Fig. 5. Effects of interface mutations on clamshell closure.
a, smFRET distributions for LBD closure for two mutants demonstrate that R177A, but not D95A, leads to a reduction in glutamate affinity, but that in the presence of a high-affinity agonist, both mutants populate fully closed states (mGluR2-WT data seen in Fig. 1 shown on the left for comparison; data presented as mean ± s.e.m.; 4–6 movies per histogram). b, In a crystal structure (PDB ID: 4XAQ) of the mGluR2 LBD, R177 adopts two distinct orientations. We speculate that the nonequivalent effects of D95A and R177A on ligand affinity and intersubunit twisting are due, at least in part, to the ability of R177 to engage R243 on the opposite protomer via a π–π stack, one of the two R177 orientations observed in the crystal structure of agonist-bound mGluR2 LBD (PDB ID: 4XAQ). Classical molecular mechanics force fields do not explicitly represent π–π interactions, suggesting that our simulations may over-represent the orientation of R177 that engages D95. Additionally, introduction of R243A in single-molecule constructs substantially reduced expression, preventing smFRET investigation. c, Conservation of the interface network across the eight mGluR subtypes found in Rattus norvegicus. Source data
Extended Data Fig. 6
Extended Data Fig. 6. smFRET distributions for the CRD sensor.
a, smFRET histograms for the CRD reporter, across three biological replicates, as shown in Fig. 3. Each column represents data collected on a given day; data presented as mean ± s.e.m.; ≥4 movies per histogram. b, CRD sensor in the presence of 10 mM Glu and 100 µM BINA across three biological replicates. We also monitored CRD twisting in the presence of the Gi1 heterotrimer across two biological replicates. Data presented as mean ± s.e.m.; ≥3 movies per histogram. c, Lower-lobe reporter (top) and CRD reporter (bottom) monitored across three different detergent solubilization conditions, in the presence and absence of glutamate. Data presented as mean ± s.e.m.; ≥4 movies per histogram. We detected few particles passing FRET criteria for the 0 mM Glu condition in the presence of DDM/CHS for the lower lobe sensor and have excluded these data from histograms. d, CRD reporter, monitored in mGluR2, mGluR2-R177A and mGluR2-D95A in the presence of 20 µM LY37 across three biological replicates. Data presented as mean ± s.e.m.; ≥4 movies per histogram. e, Evidence that at low glutamate concentrations, the lower-lobe reporter gives rise to many ‘no-FRET’ particles (Methods), that is, particles detected during peak selection that do not pass automated FRET selection criteria (FRET lifetime > 5 s). Raw (left) and normalized to 10 mM Glu (right) percentages of FRET-ing particles across a range of glutamate concentrations; error bars s.e.m. for three biological replicates. Source data
Extended Data Fig. 7
Extended Data Fig. 7. Representative smFRET traces for the CRD sensor.
a, Representative smFRET traces for the CRD sensor, collected in the presence of 10 mM glutamate. b, Viterbi paths of HMMs inferred using ebFRET are overlaid on representative traces, across different ligand conditions. Source data
Extended Data Fig. 8
Extended Data Fig. 8. Additional data related to HDX-MS experiments.
a, Size-exclusion chromatograms obtained during purification of the mGluR2 LBD dimer (left) and the full-length mGluR2 dimer (right). b, Uptake plots presented as mean uptake with data from over three independent replicates overlaid as individual points, for regions of interest shown in Fig. 4. c,d, Woods plot demonstrating deuteration differences for mGluR2 LBD alone, 0 mM Glu versus 10 mM Glu (c) and in the absence or presence of glutamate, for the LBD dimer versus the full-length mGluR (d). Source data
Extended Data Fig. 9
Extended Data Fig. 9. smFRET traces for the mGluR2 LBD closure reporter at 50 fps.
ac, mGluR2 adopts longer-lived low-FRET and high-FRET states in mGluR2/3 (a) and mGluR2/4 heterodimers (b) than in the mGluR2/7 heterodimer (c). With a Group III–specific agonist (d), mGluR2 in mGluR2/7 heterodimers occasionally populates high-FRET states. Two biological replicates (data presented as mean ± s.e.m.; 4–5 movies per histogram) show effects of LSP4-2022 on mGluR2 closure in mGluR2/7 heterodimers. Source data
Extended Data Fig. 10
Extended Data Fig. 10. Additional data related to Bayesian inference of transitions in smFRET data.
a, Histograms of smFRET traces monitoring mGluR2 clamshell closure in different heterodimeric contexts (stepped lines). Continuous lines represent the MAP-predictive density for a time-averaged two-state system inferred using the Bayesian inference method, BIASD. Global analyses were carried out separately for two biological replicates each, in which the 0 mM Glu (blue) and 10 mM Glu (green) conditions are used to increase the statistical certainty in the inferences about the kinetic properties of the clamshell-open and clamshell-closed states, respectively. b, Corner plots of posterior probability distributions for each of the four heterodimers, with rate constants estimated for 10 µM Glu, are shown for one biological replicate each. Two-dimensional heat maps represent bivariate marginal probability distributions of the MCMC samples. One-dimensional histograms represent marginal probability distributions for each individual model parameter of the MCMC samples. MAP, Maximum a Posteriori; MCMC, Markov Chain Monte Carlo. Source data

Update of

References

    1. Reiner, A. & Levitz, J. Glutamatergic signaling in the central nervous system: ionotropic and metabotropic receptors in concert. Neuron98, 1080–1098 (2018). - PMC - PubMed
    1. Ellaithy, A., Gonzalez-Maeso, J., Logothetis, D. A. & Levitz, J. Structural and biophysical mechanisms of class C G protein-coupled receptor function. Trends Biochem. Sci.45, 1049–1064 (2020). - PMC - PubMed
    1. Hansen, K. B. et al. Structure, function and pharmacology of glutamate receptor ion channels. Pharmacol. Rev.73, 298–487 (2021). - PMC - PubMed
    1. Niswender, C. M. & Conn, P. J. Metabotropic glutamate receptors: physiology, pharmacology, and disease. Annu. Rev. Pharmacol. Toxicol.50, 295–322 (2010). - PMC - PubMed
    1. Koehl, A. et al. Structural insights into the activation of metabotropic glutamate receptors. Nature566, 79–84 (2019). - PMC - PubMed

MeSH terms

LinkOut - more resources