

ATP6AP1 drives pyroptosis-mediated immune evasion in hepatocellular carcinoma: a machine learning-guided therapeutic target
- PMID: 40281381
- PMCID: PMC12032091
- DOI: 10.1007/s12672-025-02426-1
ATP6AP1 drives pyroptosis-mediated immune evasion in hepatocellular carcinoma: a machine learning-guided therapeutic target
Abstract
Background: Hepatocellular carcinoma (HCC) remains a major therapeutic challenge due to its immunosuppressive tumor microenvironment (TME) and resistance to immune checkpoint inhibitors (ICIs). Pyroptosis is a form of cell death with complex dual functions in tumor immunity. However, the precise regulatory mechanisms and interactions between pyroptosis and immune evasion in HCC remain poorly understood. This study aimed to elucidate the role of ATP6AP1 in pyroptosis-mediated TME remodeling and its potential as a therapeutic target.
Methods: We integrated large-scale datasets from TCGA and GEO databases to identify core modules by weighted gene co-expression network analysis (WGCNA), while mutation profiling and survival analysis verified clinical relevance. Multiple machine learning techniques, including GBM (gradient boosting machine), XGBoost (extreme gradient boosting machine), SVM (support vector machine), LASSO (least absolute shrinkage and selection operator) and random forest, as well as functional analysis, were used to systematically investigate the role of ATP6AP1 in HCC. Finally, CIBERSORT was used to analyze the immune infiltration pattern to gain insight into the mechanism.
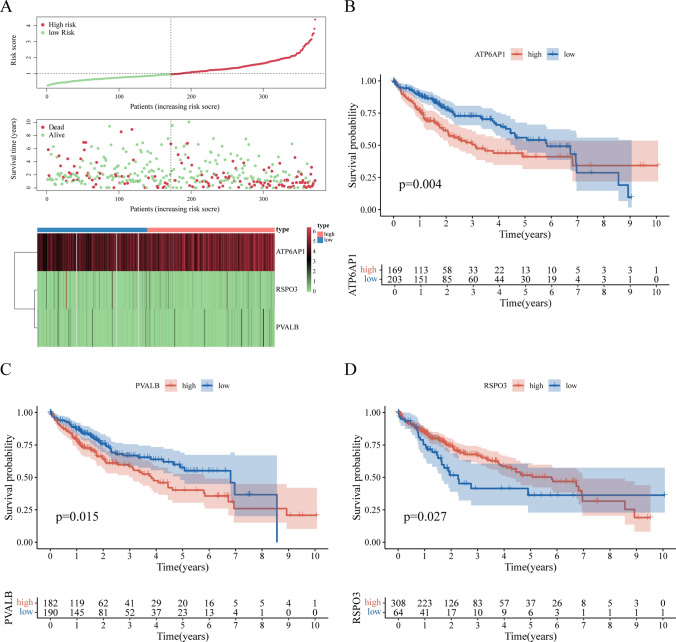
Results: Through a rigorous multi-algorithm screening process, ATP6AP1 was found to be a highly reliable biomarker with an area under the curve (AUC) of 0.979. We found that it has a recurrent C > T mutation with an incidence of 68%. Notably, its expression level was associated with stage (P < 0.001). We also found that regions with high ATP6AP1 expression were enriched in resting DCS (P < 0.05) and regulatory T cells (P < 0.05), which further promoted immunosuppressed TME.
Conclusions: In our study, the machine learning-trained diagnostic model (AUC = 0.998) and the identified pyroptosis-related core gene ATP6AP1 provided an actionable strategy to overcome immune resistance in HCC. Mechanistically, ATP6AP1 stabilizes V-ATPase, which acidifies lysosomes, impairs antigen presentation, and drives pyroptotic inflammasome activation. This study highlights that ATP6AP1 plays a key role in promoting the lysosomal acidisis-pyroptosis-immunosuppression axis, and targeting ATP6AP1 can reshape the TME and enhance the efficacy of immunotherapy in HCC patients.
Keywords: ATP6AP1; Hepatocellular carcinoma (HCC); Pyroptosis; Regulatory T cells; Resting dendritic cells; Tumor microenvironment (TME).
© 2025. The Author(s).
Conflict of interest statement
Declarations. Competing interests: The authors declare no competing interests.
Figures


Similar articles
-
Pyroptosis drives tumor progression and immune evasion in Hepatocellular Carcinoma: a single-cell and spatial transcriptomic study.Discov Oncol. 2025 May 20;16(1):834. doi: 10.1007/s12672-025-02421-6. Discov Oncol. 2025. PMID: 40394449 Free PMC article.
-
ERCC3-Related Genes May Aid in the Prognostic and Immunotherapeutic Analysis of Hepatocellular Carcinoma.Comb Chem High Throughput Screen. 2025;28(5):808-824. doi: 10.2174/0113862073288597240522064027. Comb Chem High Throughput Screen. 2025. PMID: 38859773
-
Pyroptosis-related prognosis model, immunocyte infiltration characterization, and competing endogenous RNA network of glioblastoma.BMC Cancer. 2022 Jun 3;22(1):611. doi: 10.1186/s12885-022-09706-x. BMC Cancer. 2022. PMID: 35658846 Free PMC article.
-
Construction and verification of atopic dermatitis diagnostic model based on pyroptosis related biological markers using machine learning methods.BMC Med Genomics. 2023 Jun 17;16(1):138. doi: 10.1186/s12920-023-01552-5. BMC Med Genomics. 2023. PMID: 37330465 Free PMC article.
-
Harnessing Dendritic Cell Function in Hepatocellular Carcinoma: Advances in Immunotherapy and Therapeutic Strategies.Vaccines (Basel). 2025 May 4;13(5):496. doi: 10.3390/vaccines13050496. Vaccines (Basel). 2025. PMID: 40432108 Free PMC article. Review.
References
-
- Wang L, et al. Targeting N6-methyladenosine reader YTHDF1 with siRNA boosts antitumor immunity in NASH-HCC by inhibiting EZH2-IL-6 axis. J Hepatol. 2023;79(5):1185–200. - PubMed
-
- Ur Rehman A, et al. Enhancing antitumor immunity and achieving tumor eradication with IL11RA mRNA immunotherapy. Int Immunopharmacol. 2024;134: 112205. - PubMed
-
- Bu F, et al. HCC-1 accelerates atherosclerosis by inducing endothelial cell and macrophage pyroptosis and serves as an early diagnostic biomarker. Arterioscler Thromb Vasc Biol. 2024;44(9):2088–107. - PubMed
LinkOut - more resources
Full Text Sources