

SARS-CoV-2 lineage-dependent temporal phylogenetic distribution and viral load in immunocompromised and immunocompetent individuals
- PMID: 40281619
- PMCID: PMC12023422
- DOI: 10.1186/s12985-025-02711-z
SARS-CoV-2 lineage-dependent temporal phylogenetic distribution and viral load in immunocompromised and immunocompetent individuals
Abstract
Objectives: Mutational dynamics of SARS-CoV-2 in immunocompromised hosts, although well documented, remain a relatively unexplored mechanism. This study aims to compare the viral replication load and genetic diversity of SARS-CoV-2 in immunocompromised patients and non-immunocompromised individuals (NICs) from two major hospitals in Paris from January 2021 to May 2023.
Methods: Cycle threshold (CT) values were measured by TaqPath COVID-19 RT-PCR (Thermo Fisher Scientific). The SARS-CoV-2 whole-genomes from 683 immunocompromised patients and 296 NICs was sequenced using Oxford Nanopore Technologies and used to determine lineage and mutational profile.
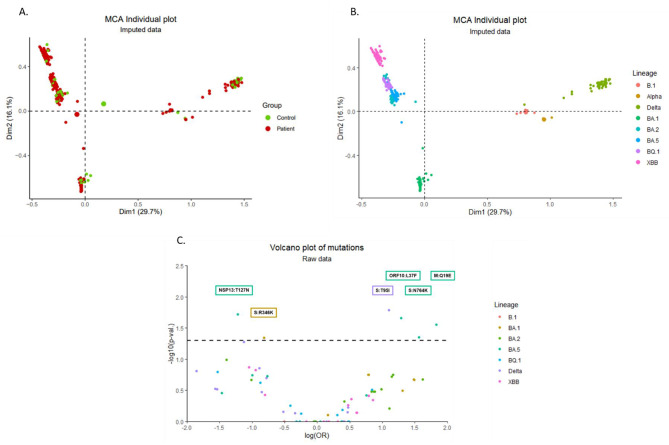
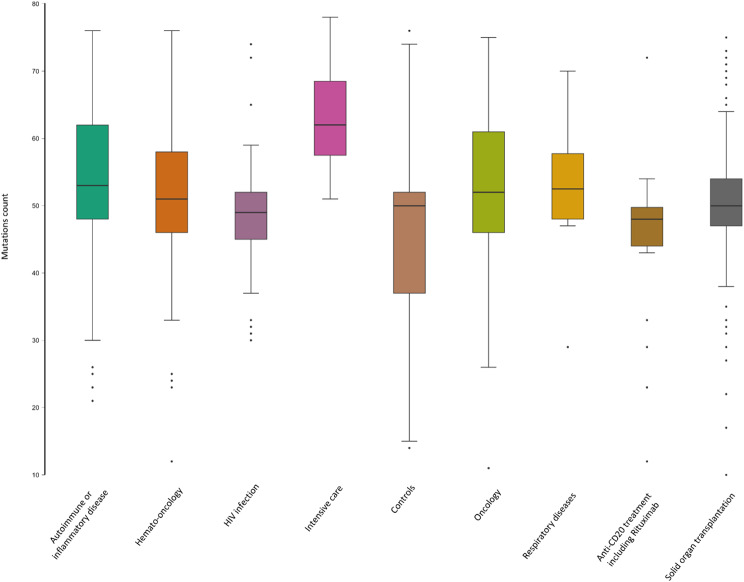
Results: All immunocompromised patients, but not oncology patients, had lower SARS-CoV-2 viral loads than NICs. The genetic distribution of SARS-CoV-2 was homogeneous between immunocompromised individuals and NICs, with more mutations in immunocompromised patients (IRR = 1,013). Indeed, extensive genomic analysis revealed several mutations specifically associated with immunosuppression status, such as S: T95I, S:N764K, M:Q19E and ORF10:L37F. Conversely, the S: R346K and NSP13:T127N mutations were more common in NICs.
Conclusion: Immunocompromised patients have lower viral loads, probably due to their later diagnosis compared to NICs and oncology patients, who have better access to on-site SARS-CoV-2 testing and follow-up. In addition, mutational profiles differ between the two groups, with immunocompromised hosts accumulating more mutations compared to NICs.
Keywords: Immunocompromised host; SARS-CoV-2; Single mutation analysis; Viral load; Whole-Genome sequencing.
© 2025. The Author(s).
Conflict of interest statement
Declarations. Ethical approval and consent to participate: The design of the work has been approved by the Research Ethics Committee for Infectious and Tropical Diseases (CERMIT; decision number: 2022-05-04). Based on standards currently applied in France individual patient information is not required for internal research. Consent for publication: Not applicable. Competing interests: The authors declare no competing interests.
Figures
Similar articles
-
The effect of sample site and collection procedure on identification of SARS-CoV-2 infection.Cochrane Database Syst Rev. 2024 Dec 16;12(12):CD014780. doi: 10.1002/14651858.CD014780. Cochrane Database Syst Rev. 2024. PMID: 39679851 Free PMC article.
-
Virological Aspects of COVID-19 in Patients with Hematological Malignancies: Duration of Viral Shedding and Genetic Analysis.Viruses. 2024 Dec 31;17(1):46. doi: 10.3390/v17010046. Viruses. 2024. PMID: 39861838 Free PMC article.
-
Laboratory-based molecular test alternatives to RT-PCR for the diagnosis of SARS-CoV-2 infection.Cochrane Database Syst Rev. 2024 Oct 14;10(10):CD015618. doi: 10.1002/14651858.CD015618. Cochrane Database Syst Rev. 2024. PMID: 39400904
-
Rapid, point-of-care antigen tests for diagnosis of SARS-CoV-2 infection.Cochrane Database Syst Rev. 2022 Jul 22;7(7):CD013705. doi: 10.1002/14651858.CD013705.pub3. Cochrane Database Syst Rev. 2022. PMID: 35866452 Free PMC article.
-
Household clusters of SARS-CoV-2 Omicron subvariants contemporaneously sequenced from dogs and their owners.mSphere. 2025 Jul 29;10(7):e0007425. doi: 10.1128/msphere.00074-25. Epub 2025 Jul 2. mSphere. 2025. PMID: 40600703 Free PMC article.
References
-
- Tarhini H et al. « Long-Term Severe Acute Respiratory Syndrome Coronavirus 2 (SARS-CoV-2) Infectiousness Among Three Immunocompromised Patients: From Prolonged Viral Shedding to SARS-CoV-2 Superinfection », J. Infect. Dis., vol. 223, no 9, pp. 1522–1527, mai., 2021, 10.1093/infdis/jiab075 - PMC - PubMed
-
- Markov PV et al. « The evolution of SARS-CoV-2 », Nat. Rev. Microbiol., vol. 21, no 6, pp. 361–379, juin., 2023, 10.1038/s41579-023-00878-2 - PubMed
-
- Leducq V, et al. « Spike protein genetic evolution in patients at high-risk of severe COVID-19 treated by monoclonal antibodies ». J Infect Dis. nov. 2023;jiad523. 10.1093/infdis/jiad523. - PubMed
Publication types
MeSH terms
LinkOut - more resources
Full Text Sources
Medical
Miscellaneous
