

Stage-dependent proteomic alterations in aqueous humor of diabetic retinopathy patients based on data-independent acquisition and parallel reaction monitoring
- PMID: 40281624
- PMCID: PMC12032686
- DOI: 10.1186/s12967-025-06452-z
Stage-dependent proteomic alterations in aqueous humor of diabetic retinopathy patients based on data-independent acquisition and parallel reaction monitoring
Abstract
Background: Diabetic retinopathy (DR), a microvascular complication of diabetes mellitus (DM), represents the predominant cause of preventable vision loss in working-age populations globally. While the pathophysiological mechanisms underlying DR progression remain incompletely understood, our study employs comprehensive proteomic profiling of aqueous humor (AH) to identify stage-specific biomarkers and therapeutic targets in type 2 diabetes mellitus (T2DM) patients across DR progression.
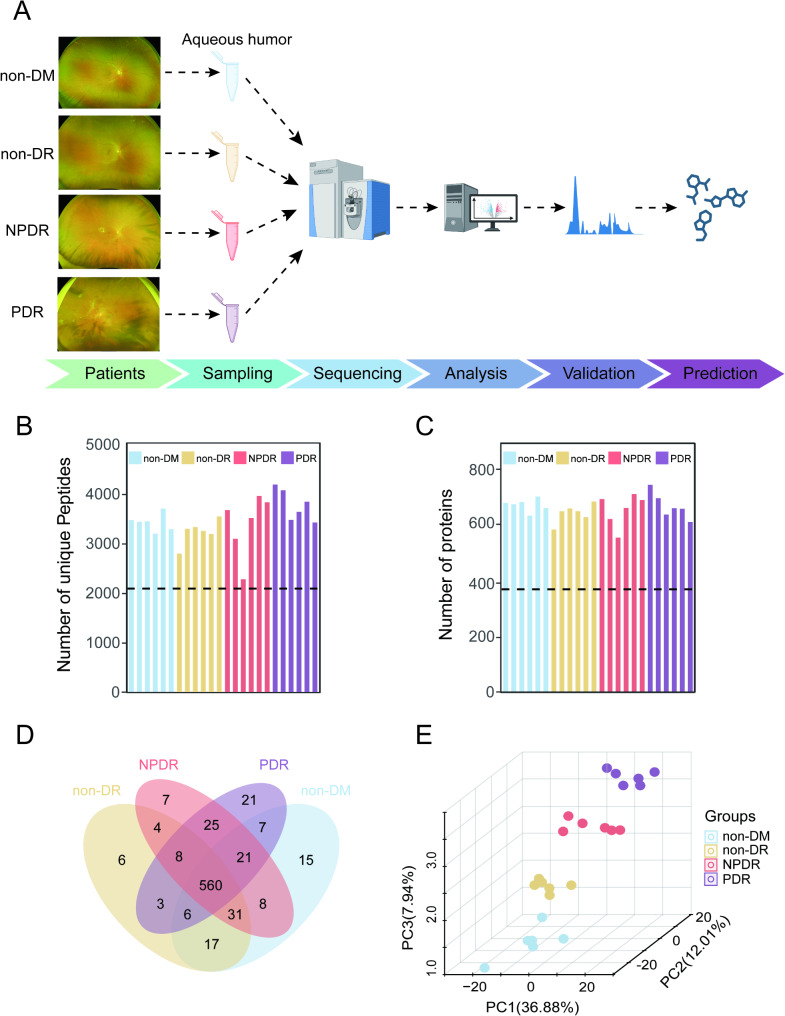
Methods: Utilizing data-independent acquisition (DIA) mass spectrometry, we quantified AH proteomes in a discovery cohort comprising 24 subjects: 18 T2DM patients stratified by DR severity [6 non-DR, 6 non-proliferative DR (NPDR), 6 proliferative DR (PDR)] and 6 cataract controls without diabetes (non-DM). Validation cohort analysis (including 10 AH samples in each group) was performed using parallel reaction monitoring (PRM) strategy for verification of target proteins. Comprehensive bioinformatics analyses included gene set enrichment analysis (GSEA), weighted gene co-expression network analysis (WGCNA), Kyoto encyclopedia of genes and genomes (KEGG) enrichment analysis, protein-protein interaction (PPI) network construction, receiver operating characteristic (ROC) curve analysis, and ConnectivityMap (Cmap)-based drug prediction.
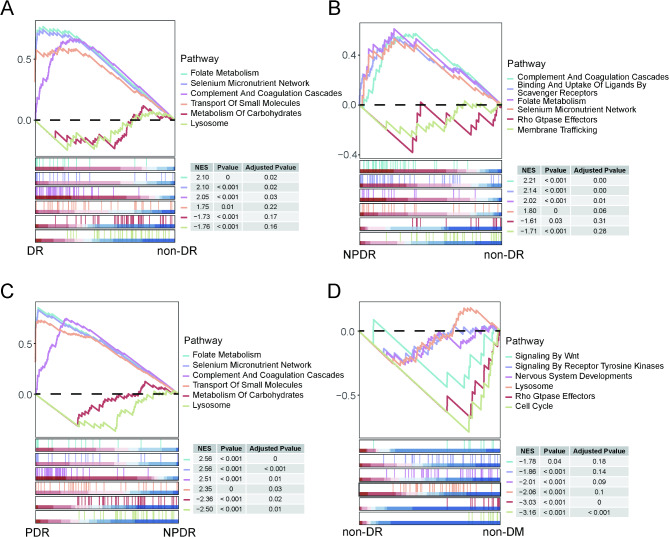
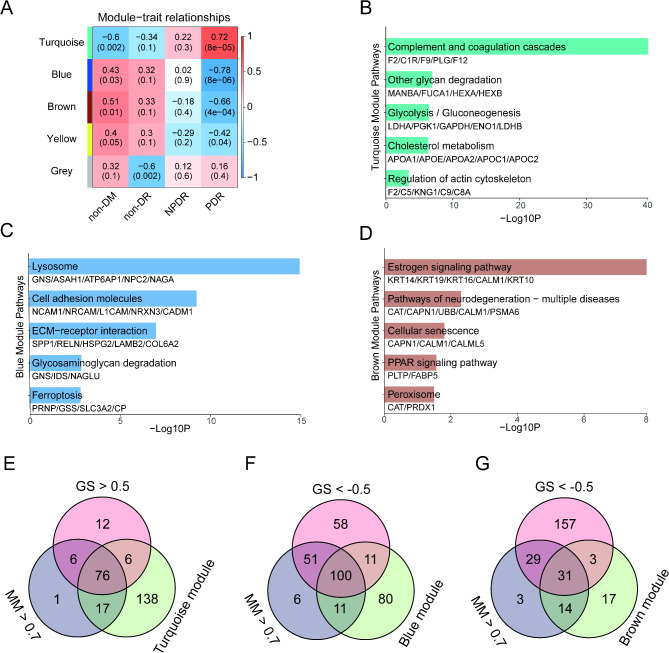
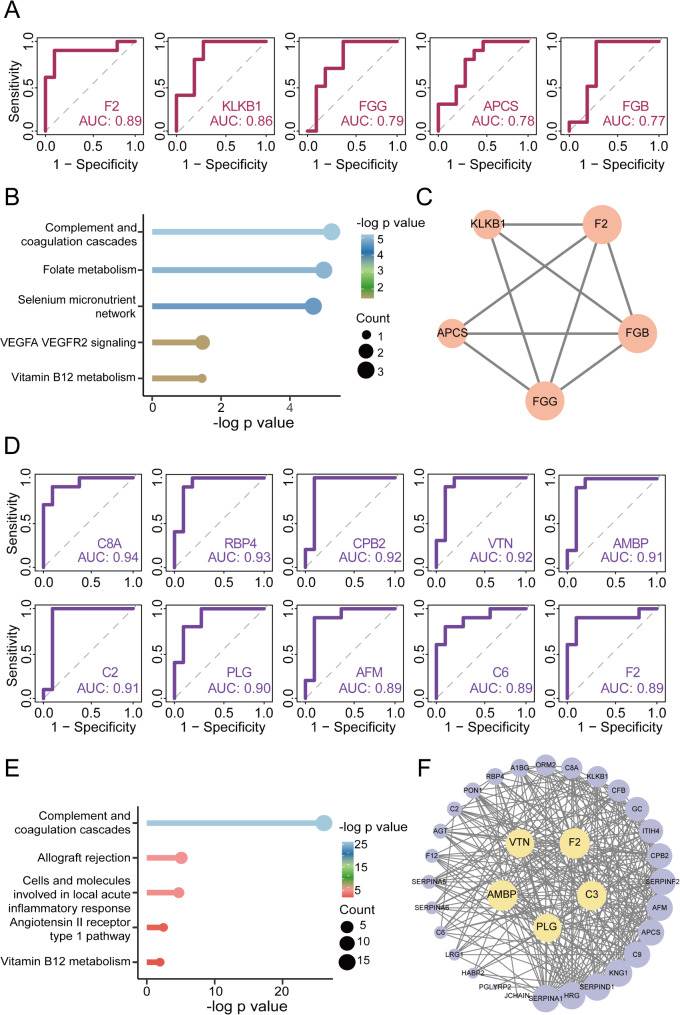
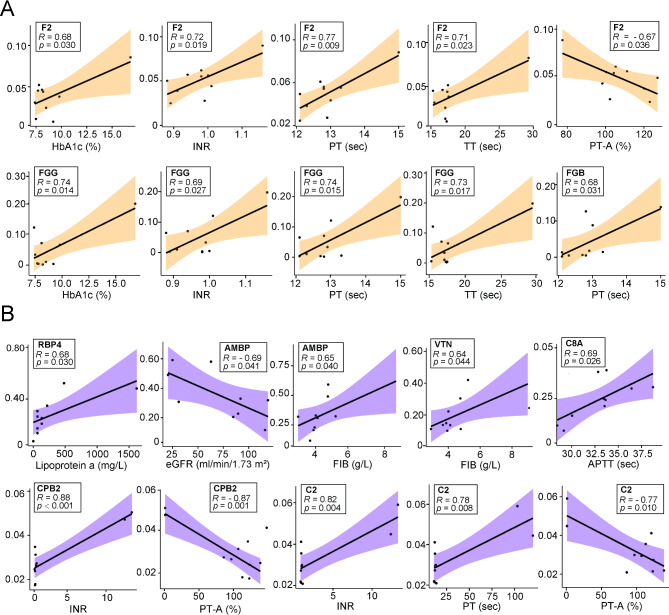
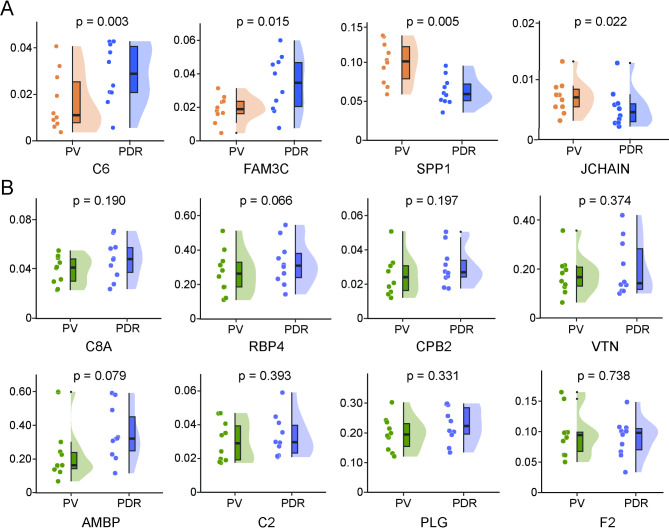
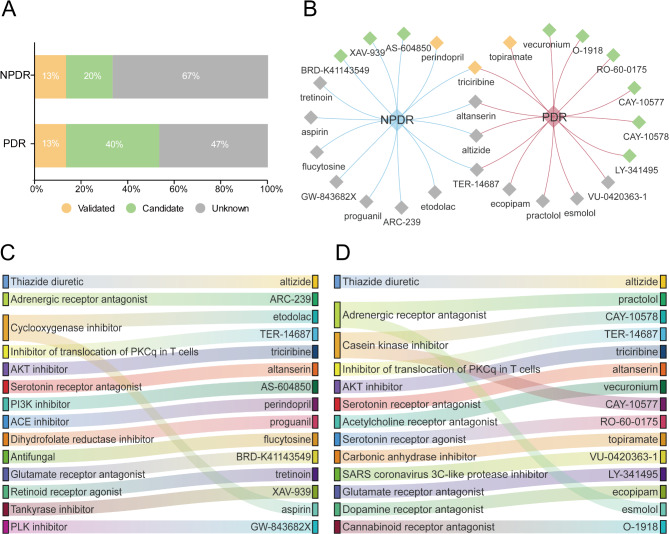
Results: Proteomic profiling identified 739 quantifiable AH proteins (62% extracellular) with clear separation among the four clinical stages in the discovery cohort. GSEA uncovered altered expression of proteins mainly related to complement and coagulation cascades, folate metabolism, and the selenium micronutrient network in patients with DR. WGCNA-derived protein modules yielded 83 PRM-validated targets, including 5 hub proteins differentiating NPDR from non-DR and 33 hub proteins showed significant upregulation in PDR versus NPDR comparison. Clinical correlation analysis identified F2, FGG, FGB, RBP4, AMBP, VTN, C8A, CPB2, and C2 associated with clinical traits. C6, FAM3C, SPP1, and JCHAIN levels were altered post-anti-VEGF treatment. Pharmacological prediction identified potential therapeutic compounds, including perindopril, triciribine, and XAV-939 for NPDR, and topiramate, triciribine, and vecuronium for PDR.
Conclusion: This study established a comprehensive AH proteomic signature of DR progression, offering insights into the pathogenesis of DR and highlighting potential biomarkers and novel therapeutic targets.
Keywords: Aqueous humor; Data-independent acquisition; Diabetic retinopathy; Parallel reaction monitoring; Proteomics.
© 2025. The Author(s).
Conflict of interest statement
Declarations. Ethics approval and consent to participate: This study was conducted following the tenets of the Declaration of Helsinki and approved by the Research Ethics Committee of Guangdong Provincial People’s Hospital (KY2024-516-02). All participants provided written informed consent. Consent for publication: All authors give their consent for publication of this manuscript. Competing interests: The authors declare that they have no competing interests.
Figures
Similar articles
-
Proteomic Analysis of Aqueous Humor Identified Clinically Relevant Molecular Targets for Neovascular Complications in Diabetic Retinopathy.Mol Cell Proteomics. 2025 Apr;24(4):100953. doi: 10.1016/j.mcpro.2025.100953. Epub 2025 Mar 19. Mol Cell Proteomics. 2025. PMID: 40118382 Free PMC article.
-
Proteome Changes Associated with the VEGFR Pathway and Immune System in Diabetic Macular Edema Patients at Different Diabetic Retinopathy Stages.Curr Eye Res. 2022 Jul;47(7):1050-1060. doi: 10.1080/02713683.2022.2068181. Epub 2022 May 3. Curr Eye Res. 2022. PMID: 35435079
-
Proteomic changes of aqueous humor in proliferative diabetic retinopathy patients treated with different intravitreal anti-VEGF agents.Exp Eye Res. 2022 Mar;216:108942. doi: 10.1016/j.exer.2022.108942. Epub 2022 Jan 13. Exp Eye Res. 2022. PMID: 35032522
-
Comprehensive Proteomic Profiling of Aqueous Humor Proteins in Proliferative Diabetic Retinopathy.Transl Vis Sci Technol. 2021 May 3;10(6):3. doi: 10.1167/tvst.10.6.3. Transl Vis Sci Technol. 2021. PMID: 34111250 Free PMC article. Review.
-
Prognostic factors for the development and progression of proliferative diabetic retinopathy in people with diabetic retinopathy.Cochrane Database Syst Rev. 2023 Feb 22;2(2):CD013775. doi: 10.1002/14651858.CD013775.pub2. Cochrane Database Syst Rev. 2023. PMID: 36815723 Free PMC article. Review.
References
MeSH terms
Substances
Grants and funding
LinkOut - more resources
Full Text Sources
Medical
Research Materials
Miscellaneous
