

Characterization of the Biochemical Recurrence Prediction Ability and Progression Correlation of Peroxiredoxins Family in Prostate Cancer Based on Integrating Single-Cell RNA-Seq and Bulk RNA-Seq Cohorts
- PMID: 40281661
- PMCID: PMC12031674
- DOI: 10.1002/cam4.70855
Characterization of the Biochemical Recurrence Prediction Ability and Progression Correlation of Peroxiredoxins Family in Prostate Cancer Based on Integrating Single-Cell RNA-Seq and Bulk RNA-Seq Cohorts
Abstract
Introduction: The peroxiredoxins (PRDXs) family plays a crucial role in balancing reactive oxygen species (ROS) levels in tumor cells. However, its potential role in prognosis and therapy response of prostate cancer (PCa) remains unknown.
Methods: In this study, we utilized 2 public single-cell RNA datasets and 8 bulk-RNA datasets to investigate the clinical value of six PRDXs family members in PCa. Expression comparison, biochemical recurrence analysis, and therapy response analysis were measured. Pathway enrichments were utilized to predict the potential down-stream pathway it may involve. In vitro experiments were used to validate the function of PRDX5 in the progression of castration-resistant prostate cancer (CRPC) cell lines.
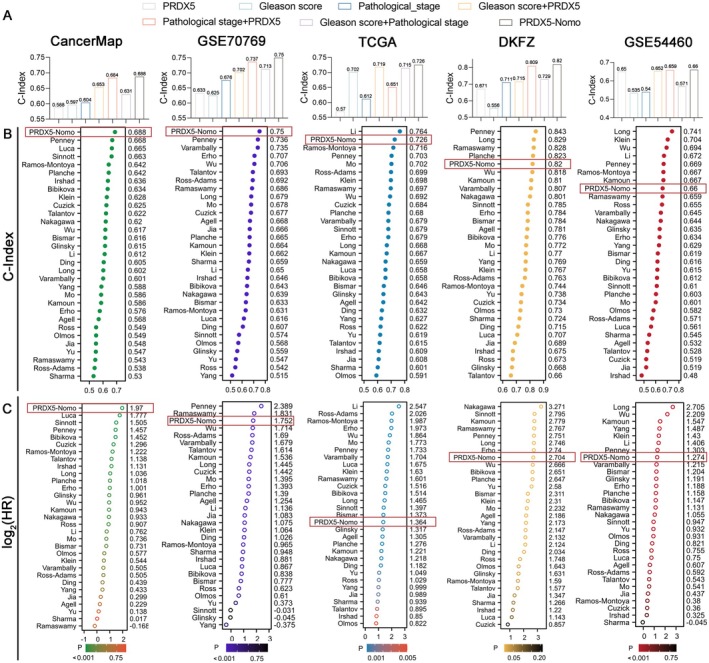
Result: Among the PRDXs family, PRDX5 was most related to the advancement of prostate cancer. A nomogram integrating the expression of PRDX5 with clinical features was developed to better predict clinical outcomes in PCa patients compared to 30 published signatures. Immunohistochemistry was used to verify that PRDX5 expression was higher in advanced levels of PCa tissue. Gene Set Enrichment Analysis (GSEA) and pathway predictive analysis revealed that the PRDX5 related genes were mainly relevant to ROS Pathway, Mitochondria-related functions, cellular respiration, and oxidative phosphorylation. In vitro cell proliferation assays, ROS determination assay, and apoptosis assay together revealed that depletion of PRDX5 induces apoptosis via ROS accumulation in CRPC cells. Moreover, the expression of PRDX5 in CRPC cells also affects the sensitivity to the ARSI therapy.
Conclusion: This study offers new evidence for determining that the expression of PRDX5 is associated with advanced tumor grade, poor prognosis, and suboptimal response to multiple therapies in PCa within the PRDXs family. Last but not least, our study provides new insights into precision medicine in PCa and provides a reference for further research on PRDX5.
Keywords: PRDX5; biochemical recurrence; peroxiredoxins; prostate cancer.
© 2025 The Author(s). Cancer Medicine published by John Wiley & Sons Ltd.
Conflict of interest statement
The authors declare no conflicts of interest.
Figures


Similar articles
-
Single-cell sequencing combined with urinary multi-omics analysis reveals that the non-invasive biomarker PRDX5 regulates bladder cancer progression through ferroptosis signaling.BMC Cancer. 2025 Mar 24;25(1):533. doi: 10.1186/s12885-025-13881-y. BMC Cancer. 2025. PMID: 40122834 Free PMC article.
-
Differential expression of peroxiredoxins in prostate cancer: consistent upregulation of PRDX3 and PRDX4.Prostate. 2011 May 15;71(7):755-65. doi: 10.1002/pros.21292. Epub 2010 Oct 28. Prostate. 2011. PMID: 21031435 Free PMC article.
-
RNA modification Regulators' Co-Expression Score (RMRCoeS) predicts biochemical recurrence and therapy response in prostate cancer: A multi-omics and experimental validation study.Int Immunopharmacol. 2024 Sep 30;139:112723. doi: 10.1016/j.intimp.2024.112723. Epub 2024 Jul 24. Int Immunopharmacol. 2024. PMID: 39053228
-
Interplay Between Mitochondrial Peroxiredoxins and ROS in Cancer Development and Progression.Int J Mol Sci. 2019 Sep 7;20(18):4407. doi: 10.3390/ijms20184407. Int J Mol Sci. 2019. PMID: 31500275 Free PMC article. Review.
-
Involvement of the PRDX family and its clinical functions in different types of gastrointestinal cancer (Review).Oncol Rep. 2025 Aug;54(2):90. doi: 10.3892/or.2025.8923. Epub 2025 Jun 6. Oncol Rep. 2025. PMID: 40476576 Review.
References
-
- Siegel R. L., Giaquinto A. N., and Jemal A., “Cancer Statistics, 2024,” CA: A Cancer Journal for Clinicians 74 (2024): 12–49. - PubMed
-
- Van den Broeck T., van den Bergh R. C. N., Arfi N., et al., “Prognostic Value of Biochemical Recurrence Following Treatment With Curative Intent for Prostate Cancer: A Systematic Review,” European Urology 75 (2019): 967–987. - PubMed
-
- Freedland S. J., Humphreys E. B., Mangold L. A., et al., “Death in Patients With Recurrent Prostate Cancer After Radical Prostatectomy: Prostate‐Specific Antigen Doubling Time Subgroups and Their Associated Contributions to All‐Cause Mortality,” Journal of Clinical Oncology: Official Journal of the American Society of Clinical Oncology 25 (2007): 1765–1771. - PubMed
-
- Rebello R. J., Oing C., Knudsen K. E., et al., “Prostate Cancer,” Nature Reviews Disease Primers 7 (2021): 9. - PubMed
MeSH terms
Substances
Grants and funding
- 82373166/National Natural Science Foundation of China
- 202201020346/Guangzhou Municipal Science and Technology Project
- No:202204053584/Health Commission of Hunan Province
- No: Z2023145/The National Key clinical specialty Major Scientific research Project
- 2023QNYXZD004/Youth Medical Innovation and Practice Research Program of Guangzhou
LinkOut - more resources
Full Text Sources
Medical
Miscellaneous
