. 2025 Jun;18(2):e70036.
doi: 10.1002/tpg2.70036.

A maize landrace introgression library reveals a negative effect of root-to-shoot ratio on water-use efficiency

Affiliations

A maize landrace introgression library reveals a negative effect of root-to-shoot ratio on water-use efficiency

Giuseppe Sciara et al. Plant Genome. 2025 Jun.

Abstract

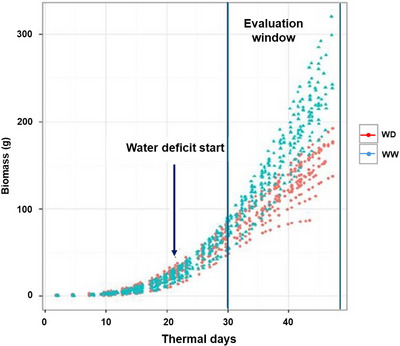
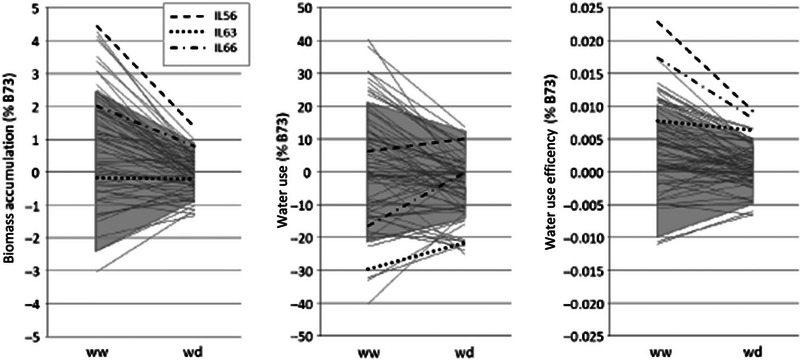
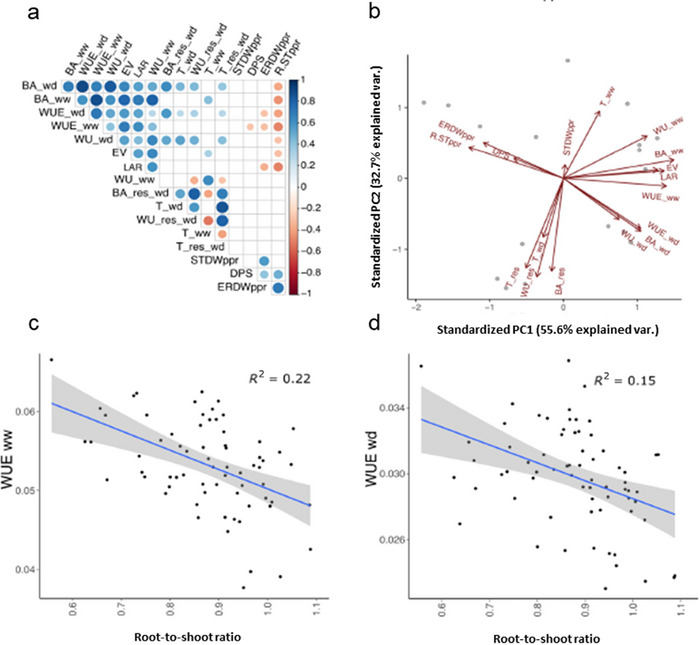
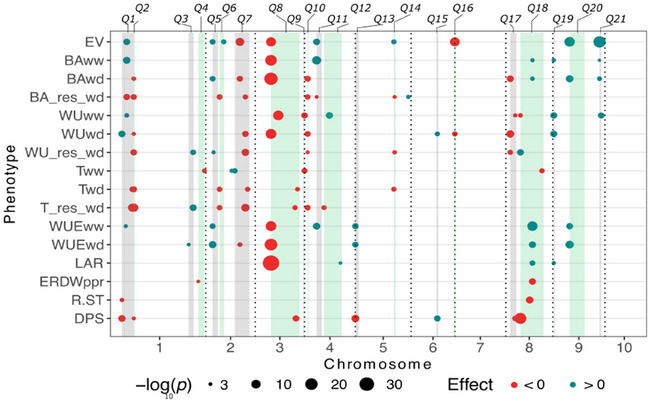
Novel sources of genetic variability for water-use efficiency (WUE) are needed in order to breed varieties more suitable to sustainable cropping systems. Here, a maize (Zea mays L.) introgression library of the landrace Gaspé Flint into the reference line B73 was characterized in high-throughput phenotyping platforms, both in well-watered and moderate water-deficit conditions, for water use, WUE, and root and shoot growth. Traits heritability ranged from 0.77 to 0.93. The introgression of Gaspé Flint chromosome segments into the B73 genome significantly altered several traits. Some introgression lines exhibited a faster shoot biomass accumulation than B73, resulting in higher WUE at the expense of root growth. Quantitative trait loci (QTL) mapping identified seven major QTL clusters affecting shoot growth and WUE, two of which overlapped, with opposite effects, with QTLs for root biomass known to include root developmental genes. These results support the non-intuitive hypothesis that reduced root-to-shoot ratio positively affects maize WUE.


Conflict of interest statement

The authors declare no conflicts of interest.

Figures

FIGURE 1
FIGURE 1
Biomass accumulation (BA) profiles, in g, in well‐watered (ww) and water‐deficit (wd) conditions during which homogeneous water conditions were maintained. The x‐axis represents thermal days (a thermal day is equivalent to the amount of heat accumulated in 24 h at 20°C constant temperature). Values for B73 only are shown as representative of the entire IL population. Each point represents a single BA estimate as detailed in Section 2, and each line of dots represents a single plant BA evolution throughout the experiment. Note that 10 plants in wd and 10 plants in ww were utilized. “Evaluation window” indicates the time period when trait values utilized for quantitative trait loci (QTL) analysis were collected.
FIGURE 2
FIGURE 2
Reaction norms of the 69 introgression lines (B73 × Gaspé Flint) from well‐watered (ww) to water‐deficit (wd) conditions for biomass accumulation, water use, and water‐use efficiency (left to right, respectively). All trait values are represented as a mean proportional deviation from B73 (B73 = 0). Values included in gray‐shaded areas are not significantly different from B73 (Dunnett's test, threshold p = 0.01). Three lines (IL56, IL63, and IL66) showing interesting responses to wd conditions are highlighted (see text).
FIGURE 3
FIGURE 3
Variation and relationships among water balance traits in the two water treatments, well‐watered (ww) and water‐deficit (wd). (a) Pearson's correlations and (b) principal component analysis (PCA) for early vigor (EV), leaf appearance rate (LAR), biomass accumulation (BA), daily water use (WU), water‐use efficiency (WUE), specific transpiration (T), responses of biomass accumulation (BA_res), daily water use (WU_res), and transpiration (T_res) to wd condition (this paper), embryonic root dry weight (ERDWppr), shoot dry weight (STDWppr), and root‐to‐shoot ratio (R.STppr) at seedling stage in semi‐hydroponic paper rolls (from Salvi et al., 2016). (c and d) Correlations between root‐to‐shoot ratio in semi‐hydroponic paper rolls and WUE in ww and wd conditions, respectively.
FIGURE 4
FIGURE 4
Quantitative trait loci (QTL) location for early vigor (EV), biomass accumulation (BA), daily water use (WU), water‐use efficiency (WUE), specific transpiration (T), BA, WU, and T responses to water‐deficit (wd) (BA_res_wd, WU_res_wd, T_res_wd), leaf appearance rate (LAR), embryonic root dry weight and root‐to‐shoot ratio at seedling stage in paper rolls (ERDWppr, R.STppr, data from Salvi et al., 2016), and days to male flowering (DPS, data from Salvi et al., 2011). Circles colocated with the QTL peaks and their diameter are proportional to the Bonferroni corrected −log10 p value; red and blue colors of the circles indicate negative and positive allelic effect of the Gaspé introgression, respectively. Shaded rectangles (green and gray) represent the confidence interval of the 21 QTL clusters.

Similar articles

References

    1. Baer, M. , Taramino, G. , Multani, D. , Sakai, H. , Jiao, S. , Fengler, K. , & Hochholdinger, F. (2023). Maize lateral rootless 1 encodes a homolog of the DCAF protein subunit of the CUL4‐based E3 ubiquitin ligase complex. The New Phytologist, 237, 1204–1214. 10.1111/nph.18599 - DOI - PubMed
    1. Bates, D. , Mächler, M. , Bolker, B. , & Walker, S. (2015). Fitting Linear Mixed‐Effects Models using lme4. Journal of Statistical Software, 67(1), 1–48. 10.18637/jss.v067.i01 - DOI
    1. Bektas, H. , Hohn, C. E. , Lukaszewski, A. J. , & Waines, J. G. (2023). On the possible trade‐off between shoot and root biomass in wheat. Plants, 12, Article 2513. 10.3390/plants12132513 - DOI - PMC - PubMed
    1. Bohn, M. , Novais, J. , Fonseca, R. , Tuberosa, R. , & Grift, T. E. (2006). Genetic evaluation of root complexity in maize. Acta Agronomica Hungarica, 54, 291–303. 10.1556/AAgr.54.2006.3.3 - DOI
    1. Bradbury, P. J. , Zhang, Z. , Kroon, D. E. , Casstevens, T. M. , Ramdoss, Y. , & Buckler, E. S. (2007). TASSEL: Software for association mapping of complex traits in diverse samples. Bioinformatics, 23, 2633–2635. - PubMed

LinkOut - more resources