

Using Surface Topography to Visualize Spinal Motion During Gait-Examples of Possible Applications and All Tools for Open Science
- PMID: 40281708
- PMCID: PMC12025307
- DOI: 10.3390/bioengineering12040348
Using Surface Topography to Visualize Spinal Motion During Gait-Examples of Possible Applications and All Tools for Open Science
Abstract
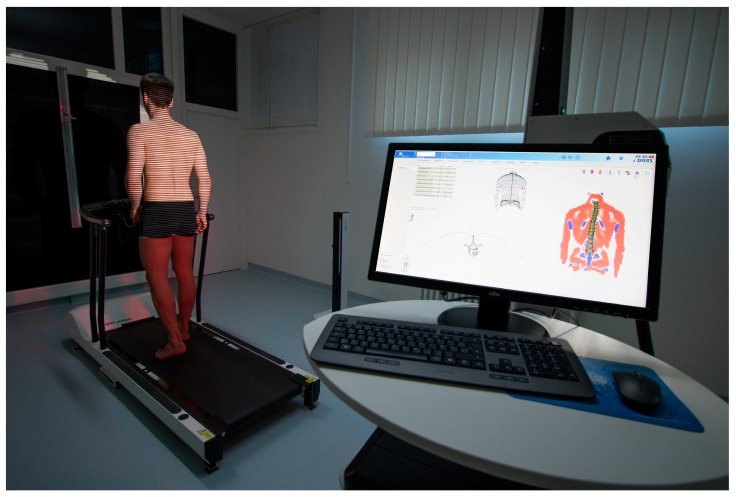
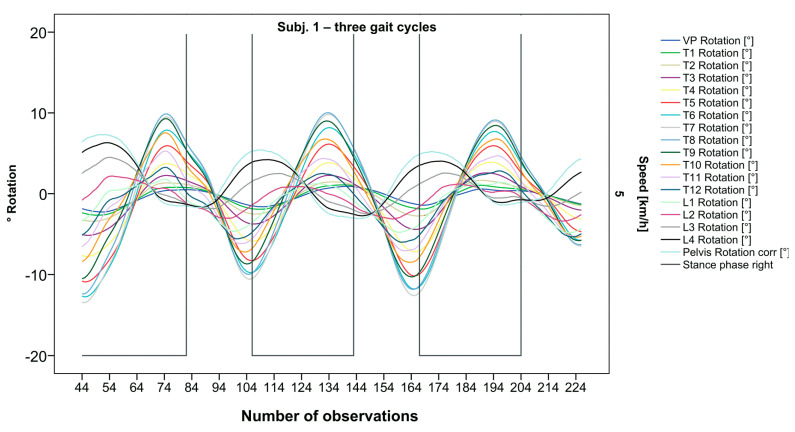
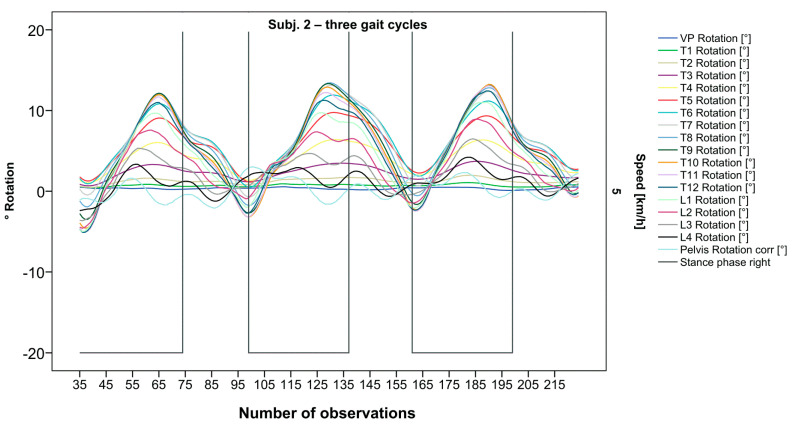
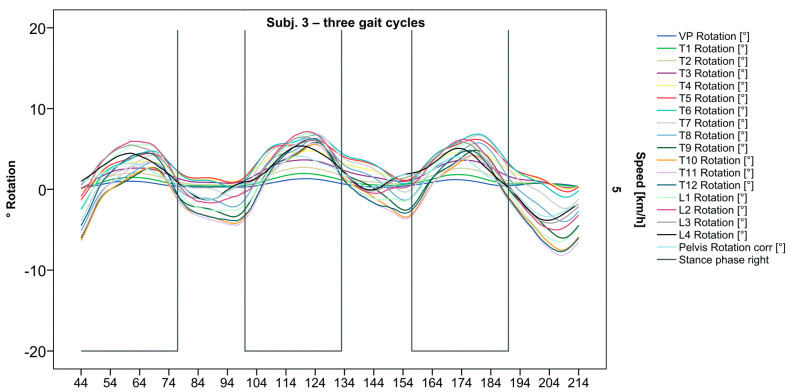
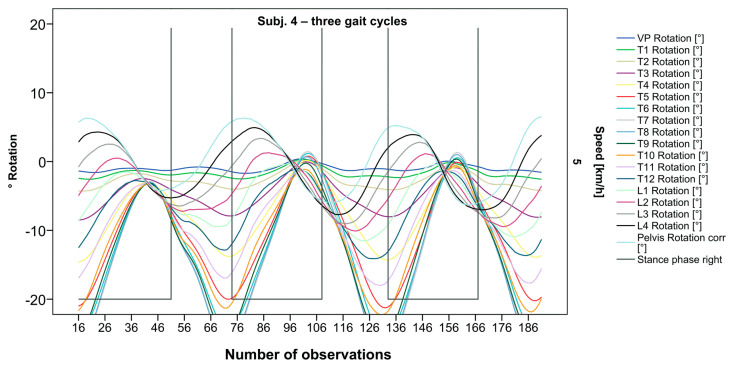
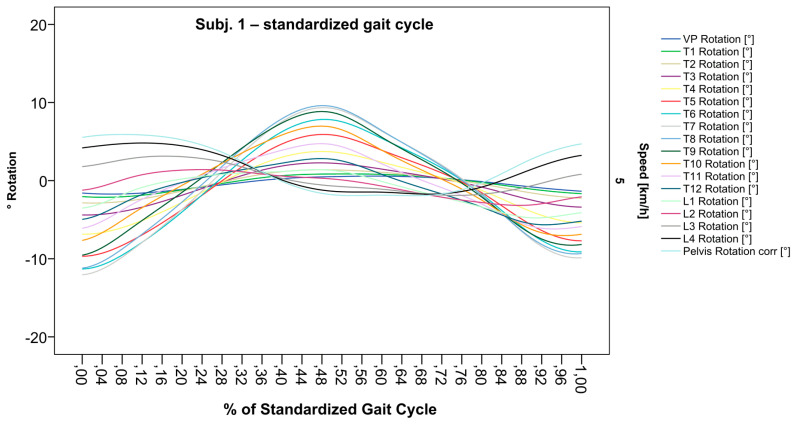
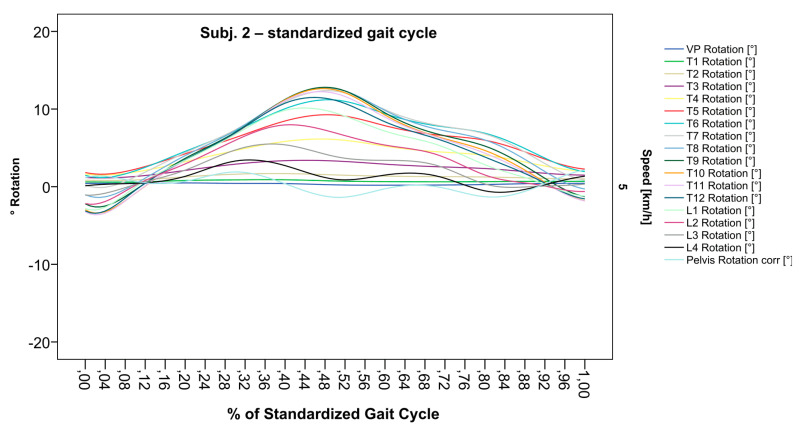
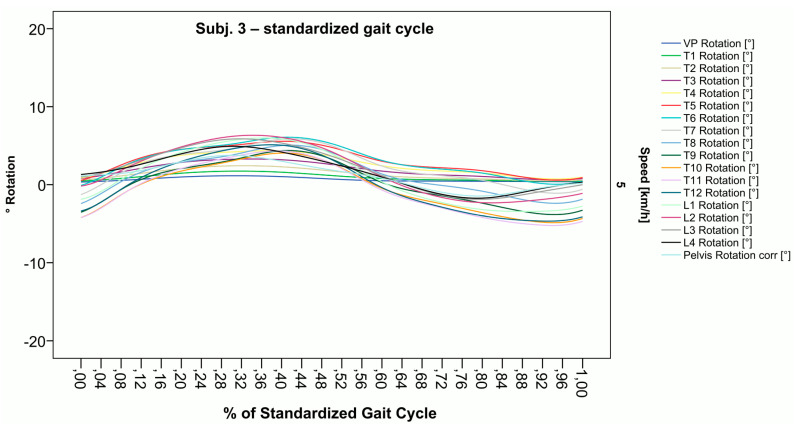
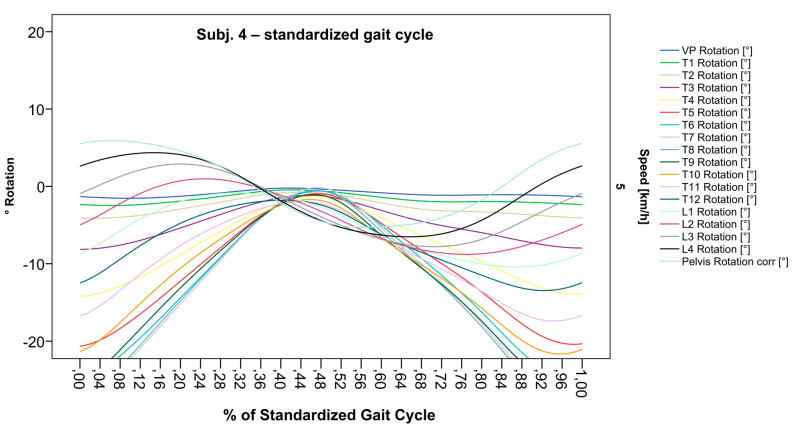
Precise segmental spinal analysis during gait has various implications for clinical use and basic research. Here, we report the use of Surface Topography (ST) to analyze three-dimensional spinal segment movements, in combination with foot pressure measuring, to describe individual vertebral bodies' motion relative to specific phases of gait. Using Statistical Analysis System (SAS) scripts, single files were merged into one raw data table and were used to generate a standardized gait cycle (SGC) for each measurement, including all measured gait cycles for each individual patient, with a spline function to obtain smooth curve progressions. Graph templates from Statistical Package for the Social Sciences create detailed visualizations of the SGCs. Previously obtained measurements from healthy participants were used to demonstrate possible applications of our method. An impressive inter-individual variability as well as intra-individual consistency of spinal motion is shown. The transformation into an SGC facilitates intra- and inter-individual comparisons for qualitative and quantitative analyses. In future studies, we want to use this method to distinguish between physiologic and pathologic spinal motion. Artificial intelligence-based analysis can facilitate this process. All tools and visualizations used are freely available in repositories to enable the replication and validation of our findings.
Keywords: graph-based representation; motion analysis; rasterstereography; spine biomechanics; surface topography.
Conflict of interest statement
The authors declare no conflicts of interest.
Figures
Similar articles
-
Dynamic surface topography data for assessing intra- and interindividual variation of vertebral motion.Data Brief. 2023 Apr 26;48:109178. doi: 10.1016/j.dib.2023.109178. eCollection 2023 Jun. Data Brief. 2023. PMID: 37383806 Free PMC article.
-
Comprehensive visualization of spinal motion in gait sequences based on surface topography.Hum Mov Sci. 2022 Feb;81:102919. doi: 10.1016/j.humov.2021.102919. Epub 2021 Dec 31. Hum Mov Sci. 2022. PMID: 34979480
-
Consistency of vertebral motion and individual characteristics in gait sequences.Hum Mov Sci. 2023 Feb;87:103036. doi: 10.1016/j.humov.2022.103036. Epub 2022 Nov 14. Hum Mov Sci. 2023. PMID: 36395570
-
Reference values and functional descriptions of transverse plane spinal dynamics during gait based on surface topography.Hum Mov Sci. 2023 Apr;88:103054. doi: 10.1016/j.humov.2022.103054. Epub 2023 Jan 6. Hum Mov Sci. 2023. PMID: 36621141
-
Applications of Biomechanical Foot Models to Evaluate Dance Movements Using Three-Dimensional Motion Capture: A Review of the Literature.J Dance Med Sci. 2022 Jun 15;26(2):69-86. doi: 10.12678/1089-313X.061522a. Epub 2022 Mar 15. J Dance Med Sci. 2022. PMID: 35287789 Review.
References
-
- Fachgesellschaften, Arbeitsgemeinschaft der Wissenschaftlichen Medizinischen. Bundesärztekammer (BÄK) Kassenärztliche Bundesvereinigung (KBV) Programm für Nationale VersorgungsLeitlinien. AZQ. 2017;2 doi: 10.6101/AZQ/000353. - DOI
-
- Brambilla C., Lavit Nicora M., Storm F., Reni G., Malosio M., Scano A. Biomechanical Assessments of the Upper Limb for Determining Fatigue, Strain and Effort from the Laboratory to the Industrial Working Place: A Systematic Review. Bioengineering. 2023;10:445. doi: 10.3390/bioengineering10040445. - DOI - PMC - PubMed
LinkOut - more resources
Full Text Sources
