

Stabilizing Total Mixed Ration Dry Matter to Mitigate Environmental-Relative-Humidity Effects on Lactating Cow Performance
- PMID: 40281971
- PMCID: PMC12024118
- DOI: 10.3390/ani15081137
Stabilizing Total Mixed Ration Dry Matter to Mitigate Environmental-Relative-Humidity Effects on Lactating Cow Performance
Abstract
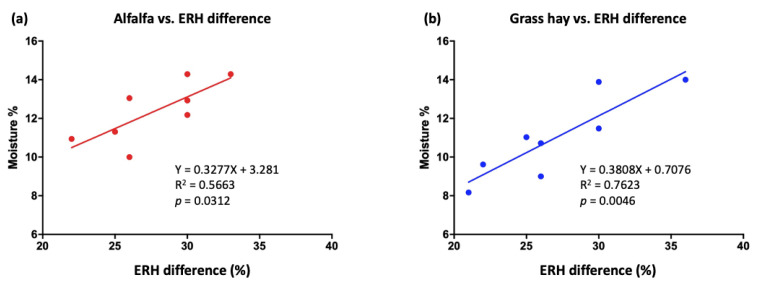
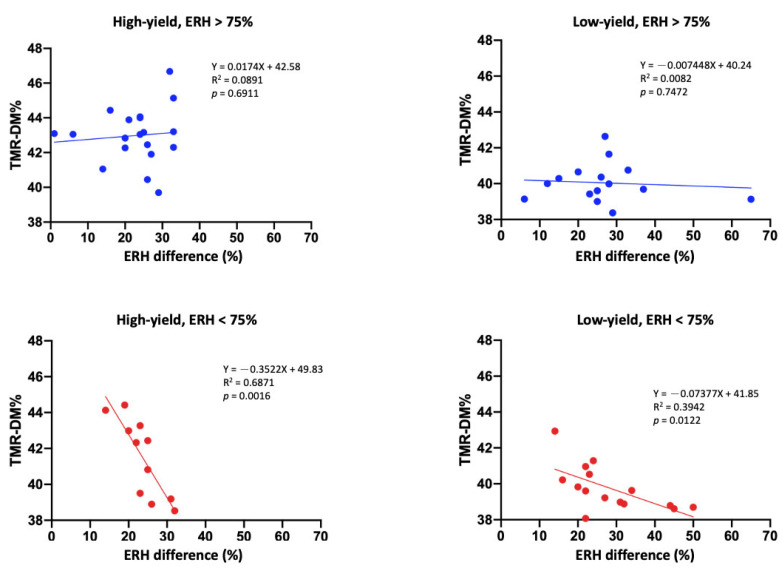
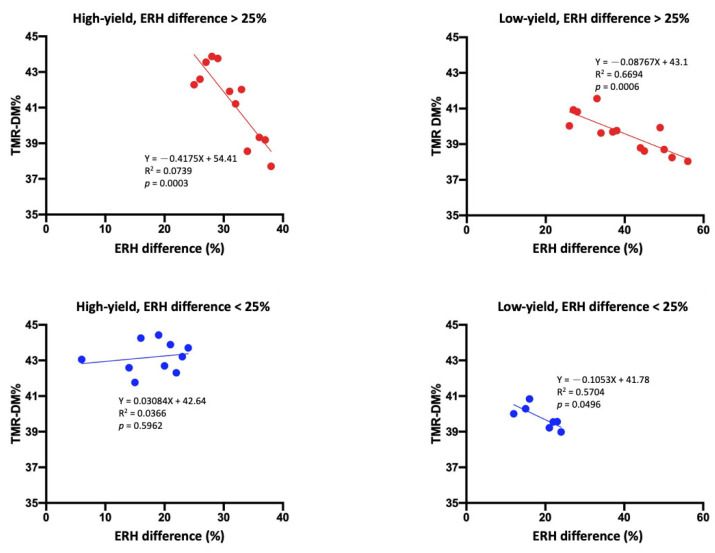
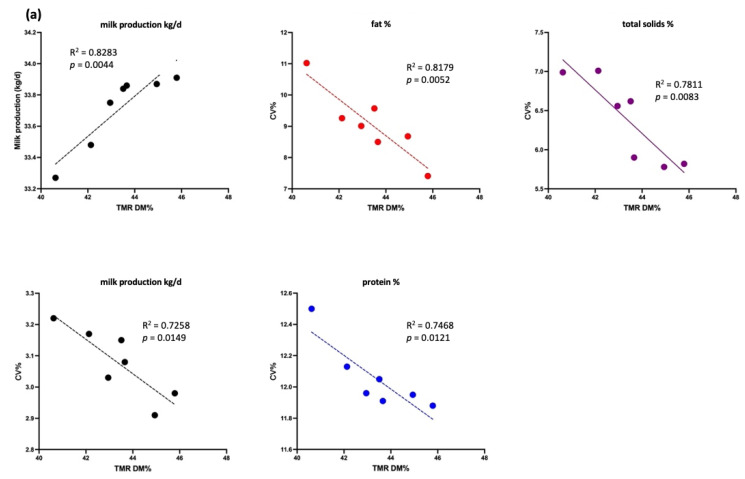
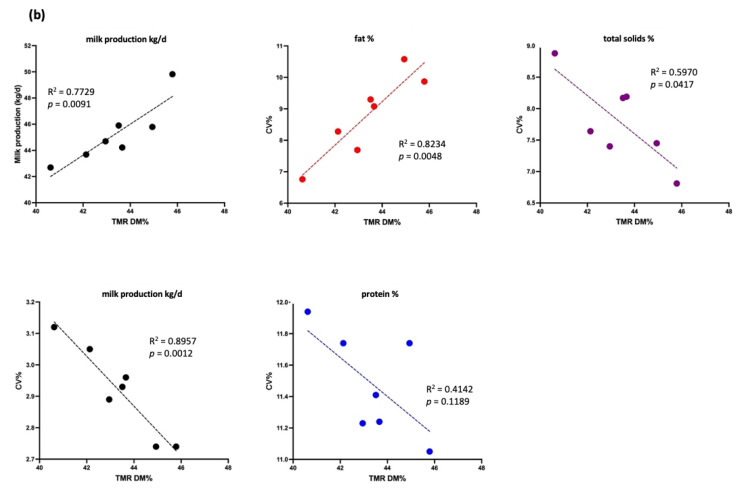
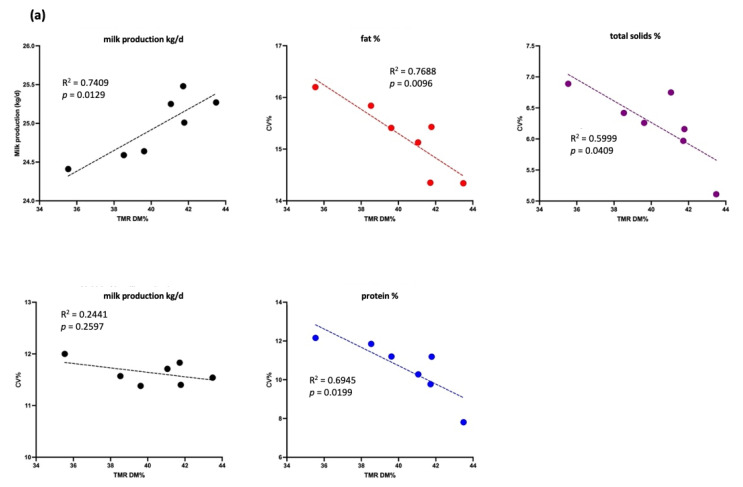
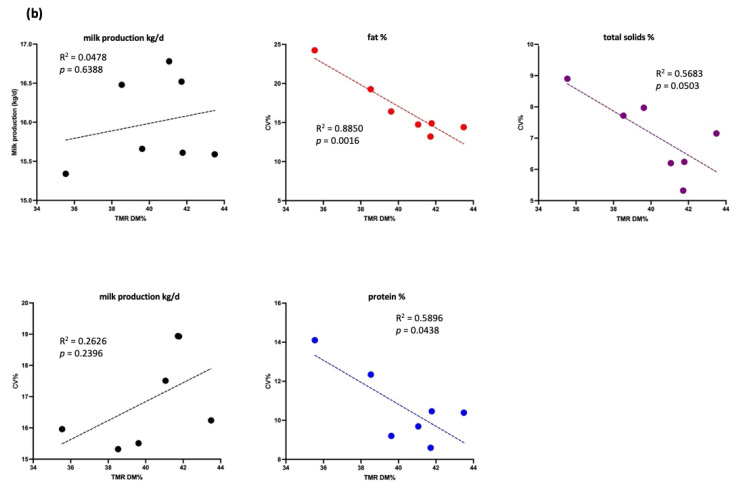
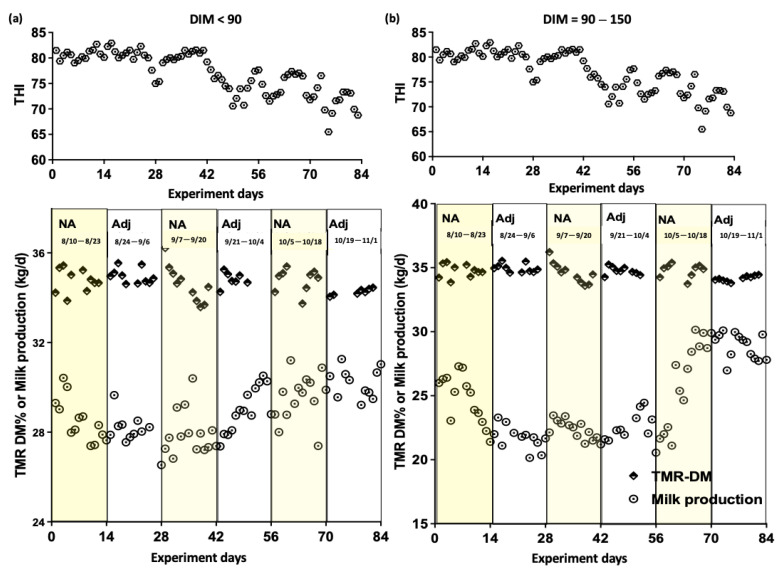
This study evaluated environmental relative humidity's (ERH) impact on dry matter (DM) in hay and total mixed ration (TMR), exploring strategies to stabilize milk production in lactating cows by maintaining a consistent TMR DM content. We hypothesized that precise TMR DM adjustments mitigate ERH effects on milk production stability. Experiment 1 showed that grass hay exhibited greater DM variability than alfalfa hay under high ERH. Experiment 2 revealed that high daily ERH variability (>25%) caused fluctuations in hay moisture, affecting TMR DM stability. Increasing TMR DM reduced milk composition variation. In Experiment 3, precise TMR DM adjustments and heat stress levels were evaluated under different temperature-humidity indexes (THIs) in 46 cows over three 28-day periods. The results showed a significant improvement in milk yield (non-adjustment: 26.99 vs. adjustment: 27.29; SEM: 0.32; THIs: 65 to 82; p < 0.05) and a reduction in the variation in milk composition under heat stress. The differences in energy-corrected milk were lower (non-adjustment: 0.47 ± 0.06 vs. adjustment: 0.20 ± 0.09; p < 0.05). This study confirmed that monitoring hay DM and adjusting TMR DM stabilize milk production under variable ERH. Dairy producers can implement routine hay DM monitoring and TMR adjustments to enhance lactating cows' performance.
Keywords: dry matter; energy-corrected milk; hay; moisture stabilization; precision feeding; temperature–humidity indexes.
Conflict of interest statement
The authors declare no conflicts of interest.
Figures
Similar articles
-
Effect of feeding long or short wheat hay v. wheat silage in the ration of lactating cows on intake, milk production and digestibility.Animal. 2017 Dec;11(12):2203-2210. doi: 10.1017/S1751731117001100. Epub 2017 May 23. Animal. 2017. PMID: 28532526
-
Feeding lactating dairy cattle long hay separate from the total mixed ration can maintain dry matter intake during incidents of low rumen pH.J Dairy Sci. 2014 Nov;97(11):7175-84. doi: 10.3168/jds.2014-8412. Epub 2014 Sep 6. J Dairy Sci. 2014. PMID: 25200785 Clinical Trial.
-
Effects of a perennial ryegrass diet or total mixed ration diet offered to spring-calving Holstein-Friesian dairy cows on methane emissions, dry matter intake, and milk production.J Dairy Sci. 2011 Apr;94(4):1941-51. doi: 10.3168/jds.2010-3361. J Dairy Sci. 2011. PMID: 21426985 Clinical Trial.
-
Changes in milk production and blood metabolism of lactating dairy cows fed Saccharomyces cerevisiae culture fluid under heat stress.J Anim Sci Technol. 2021 Nov;63(6):1433-1442. doi: 10.5187/jast.2021.e114. Epub 2021 Nov 30. J Anim Sci Technol. 2021. PMID: 34957456 Free PMC article.
-
Effects of mechanical processing on the nutritive value of barley silage for lactating dairy cows.J Dairy Sci. 2004 Dec;87(12):4170-7. doi: 10.3168/jds.S0022-0302(04)73560-2. J Dairy Sci. 2004. PMID: 15545379
References
-
- Denißen J., Beintmann S., Hoppe S., Pries M., Hummel J., Süedekum K.H. Influence of the addition of water to total mixed rations on the feeding behavior, feed intake and milk performance of high-yielding dairy cows. Livest. Sci. 2021;254:104743. doi: 10.1016/j.livsci.2021.104743. - DOI
-
- Weiss W.P., Shoemaker D., McBeth L., Yoder P., St-Pierre N. Within farm variation in nutrient composition of feeds; Proceedings of the Tri-State Dairy Nutrition Conference; Fort Wayne, IN, USA. 24–25 April 2012; pp. 103–117.
-
- Koakoski D.L., Bordin T., Cavallini D., Buonaiuto G. A preliminary study of the effects of gaseous ozone on the microbiological and chemical characteristics of whole-plant corn silage. Fermentation. 2024;10:398. doi: 10.3390/fermentation10080398. - DOI
Grants and funding
LinkOut - more resources
Full Text Sources
