

Metrics of Genomic Complexity in the Evolution of Bacterial Endosymbiosis
- PMID: 40282203
- PMCID: PMC12024623
- DOI: 10.3390/biology14040338
Metrics of Genomic Complexity in the Evolution of Bacterial Endosymbiosis
Abstract
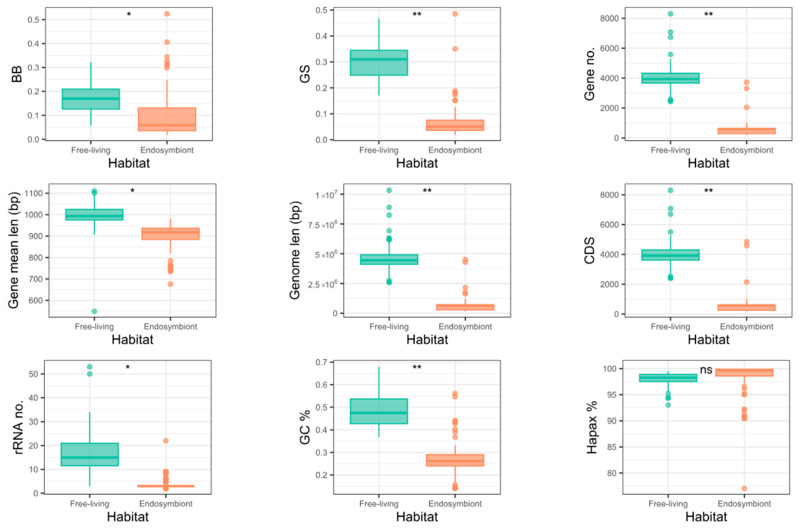
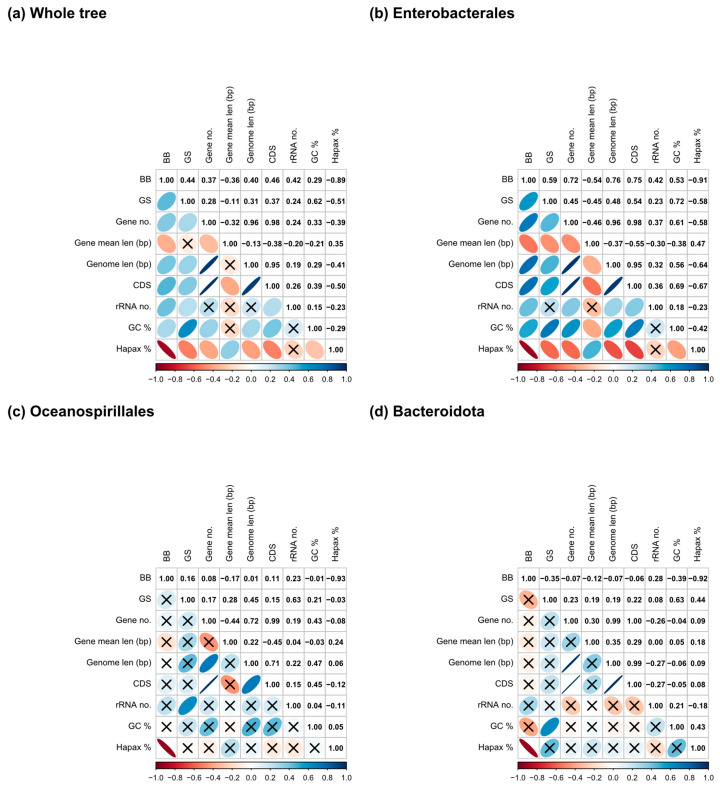
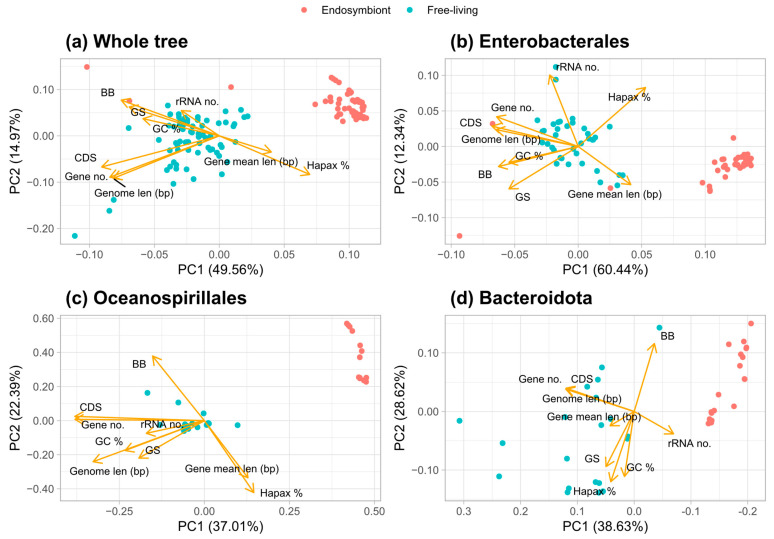
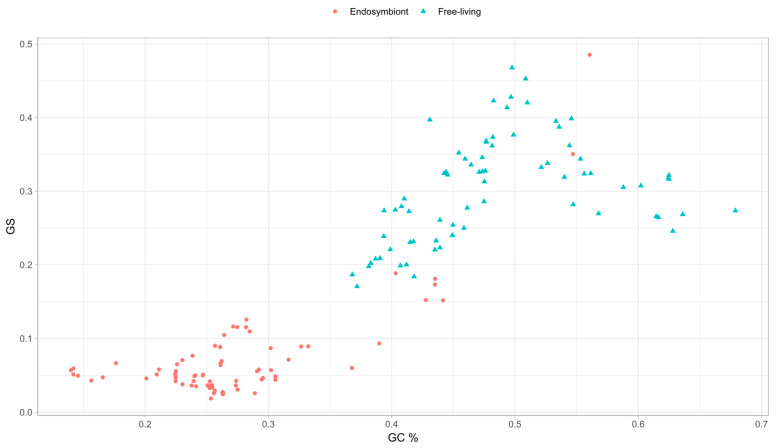
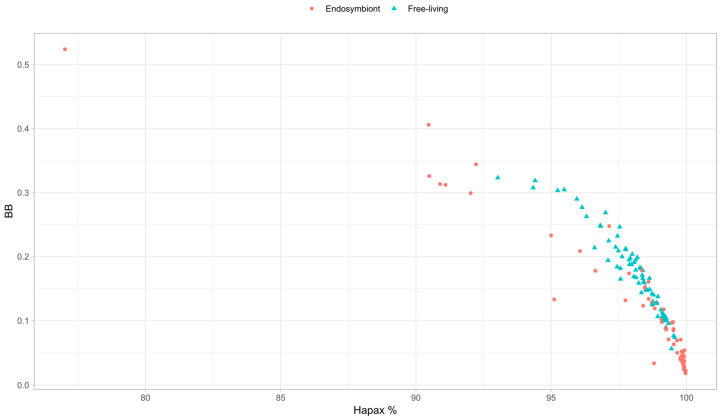
Endosymbiosis can be considered a regressive or degenerative evolutionary process characterized at the genomic level by genome erosion and degeneration due to high mutational pressure toward AT (adenine and thymine) bases. The genomic and biological complexity of endosymbionts must be lower than that of the free-living bacteria from which they evolved. In the present work, we contrasted whether two proposed metrics for measuring genomic complexity in both types of bacteria, GS and BB, reflect their complexity, expecting higher values in free-living bacteria than in endosymbionts. On the other hand, we endeavored to delve into the factors that contribute to the reduction in metric values in endosymbionts, as well as their eventual relationship with six genomic parameters associated with functionality. This study aimed to test the robustness of these proposed metrics in a well-known biological scenario, such as the endosymbiosis process.
Keywords: complexity metrics; endosymbiosis; genomic complexity.
Conflict of interest statement
The authors declare no conflicts of interest.
Figures

Similar articles
-
In it for the long haul: evolutionary consequences of persistent endosymbiosis.Curr Opin Genet Dev. 2017 Dec;47:83-90. doi: 10.1016/j.gde.2017.08.006. Epub 2017 Sep 19. Curr Opin Genet Dev. 2017. PMID: 28934627 Review.
-
Genome reduction and horizontal gene transfer in the evolution of Endomicrobia-rise and fall of an intracellular symbiosis with termite gut flagellates.mBio. 2024 Jun 12;15(6):e0082624. doi: 10.1128/mbio.00826-24. Epub 2024 May 14. mBio. 2024. PMID: 38742878 Free PMC article.
-
Conflict and cooperation in eukaryogenesis: implications for the timing of endosymbiosis and the evolution of sex.J R Soc Interface. 2015 Oct 6;12(111):20150584. doi: 10.1098/rsif.2015.0584. J R Soc Interface. 2015. PMID: 26468067 Free PMC article.
-
Long-term evolutionary stability of bacterial endosymbiosis in curculionoidea: additional evidence of symbiont replacement in the dryophthoridae family.Mol Biol Evol. 2008 May;25(5):859-68. doi: 10.1093/molbev/msn027. Epub 2008 Feb 29. Mol Biol Evol. 2008. PMID: 18310662
-
Endosymbiont evolution: predictions from theory and surprises from genomes.Ann N Y Acad Sci. 2015 Dec;1360(1):16-35. doi: 10.1111/nyas.12740. Epub 2015 Apr 9. Ann N Y Acad Sci. 2015. PMID: 25866055 Free PMC article. Review.
References
-
- McShea D.W., Brandon R.N. Biology’s First Law: The Tendency for Diversity and Complexity to Increase in Evolutionary Systems. 1st ed. University of Chicago Press; Chicago, IL, USA: 2010.
-
- Adami C., Cerf N.J., Kellogg W.K. Physical Complexity of Symbolic Sequences. Physica D Nonlinear Phenom. 2000;137:62–69.
Grants and funding
LinkOut - more resources
Full Text Sources
