

Effects of Coatings on Antioxidant Enzyme Activities, Histopathology, and Transcriptome Profiles of Kidney Tissue in Larimichthys crocea
- PMID: 40282352
- PMCID: PMC12026950
- DOI: 10.3390/genes16040392
Effects of Coatings on Antioxidant Enzyme Activities, Histopathology, and Transcriptome Profiles of Kidney Tissue in Larimichthys crocea
Abstract
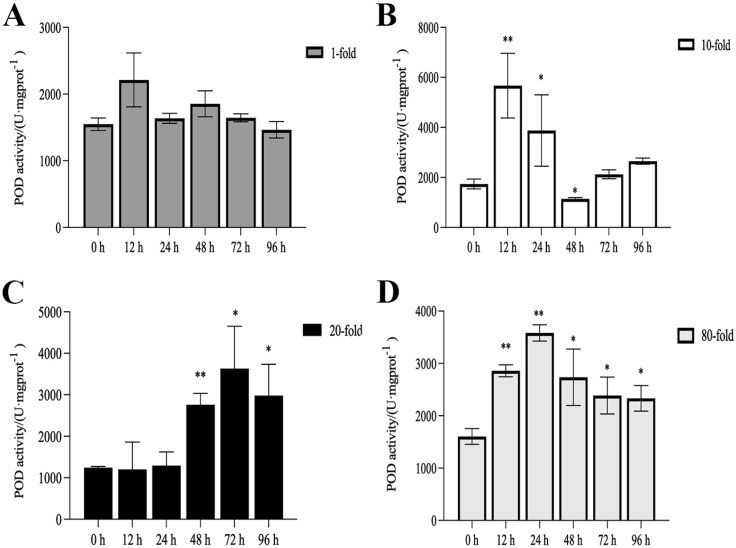
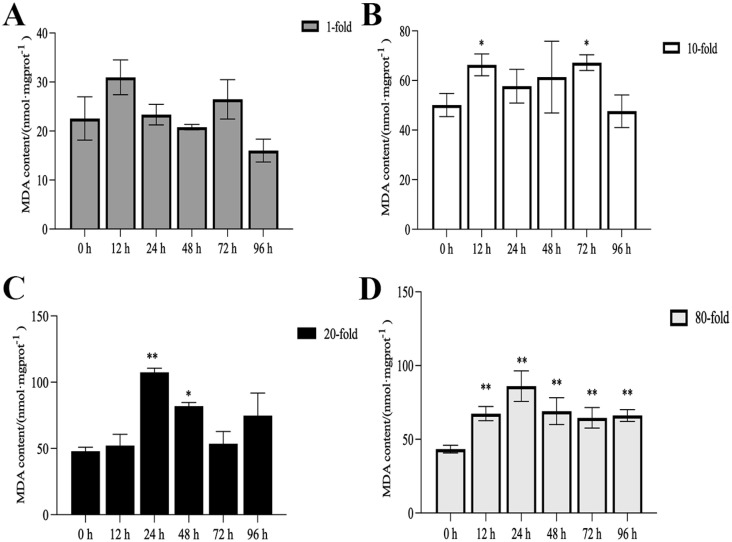
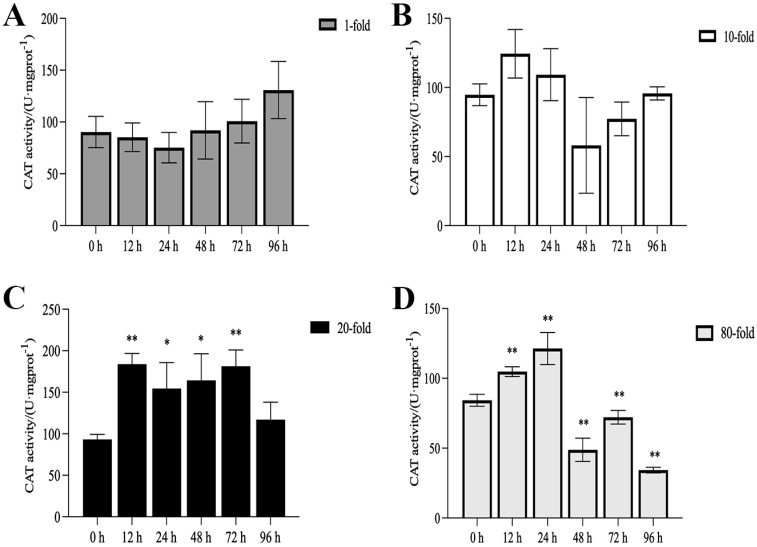
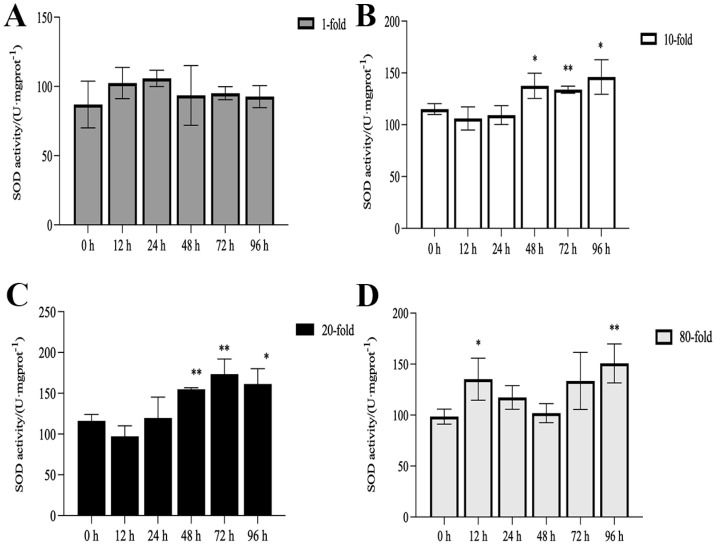
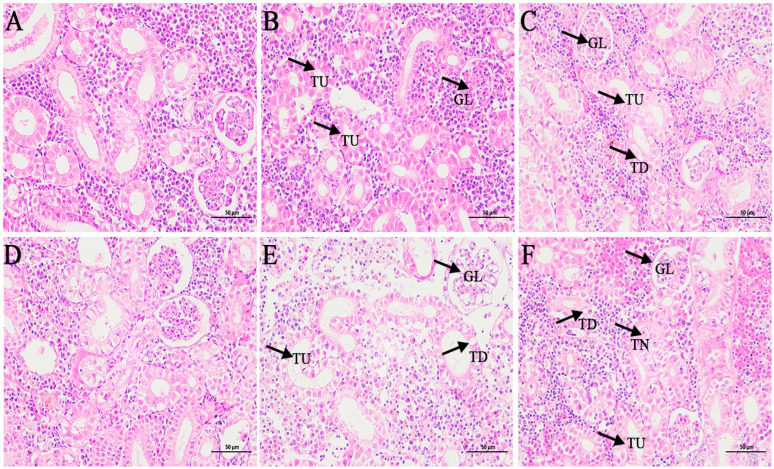
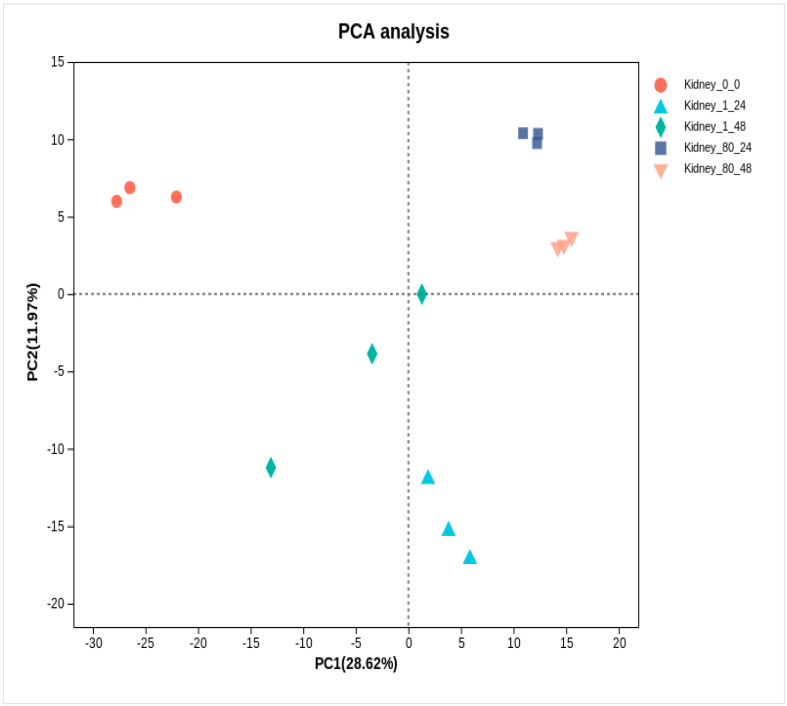
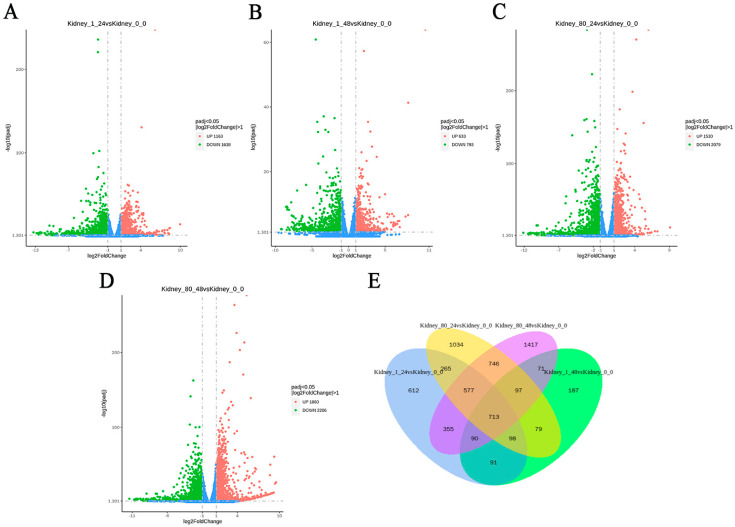
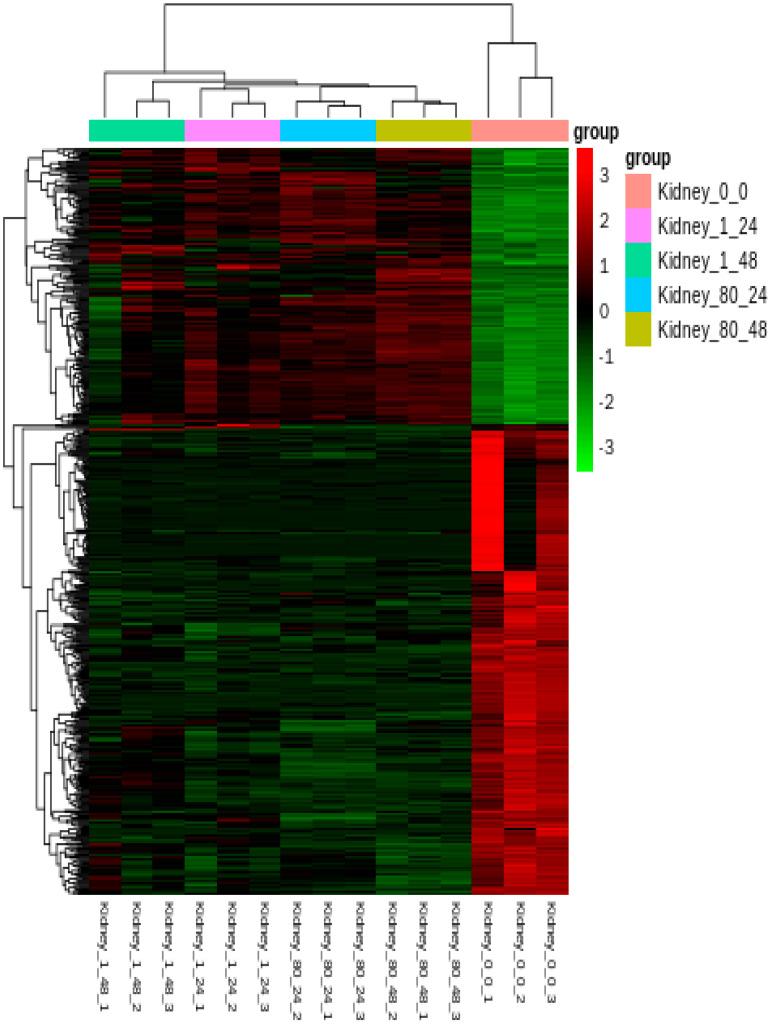
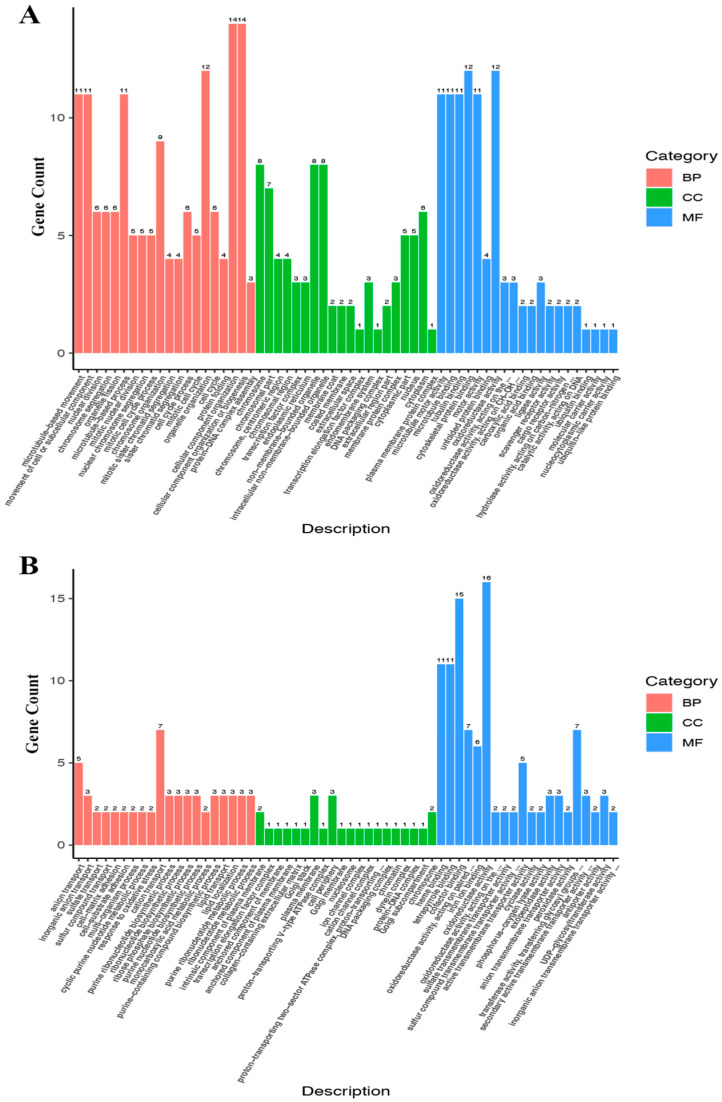
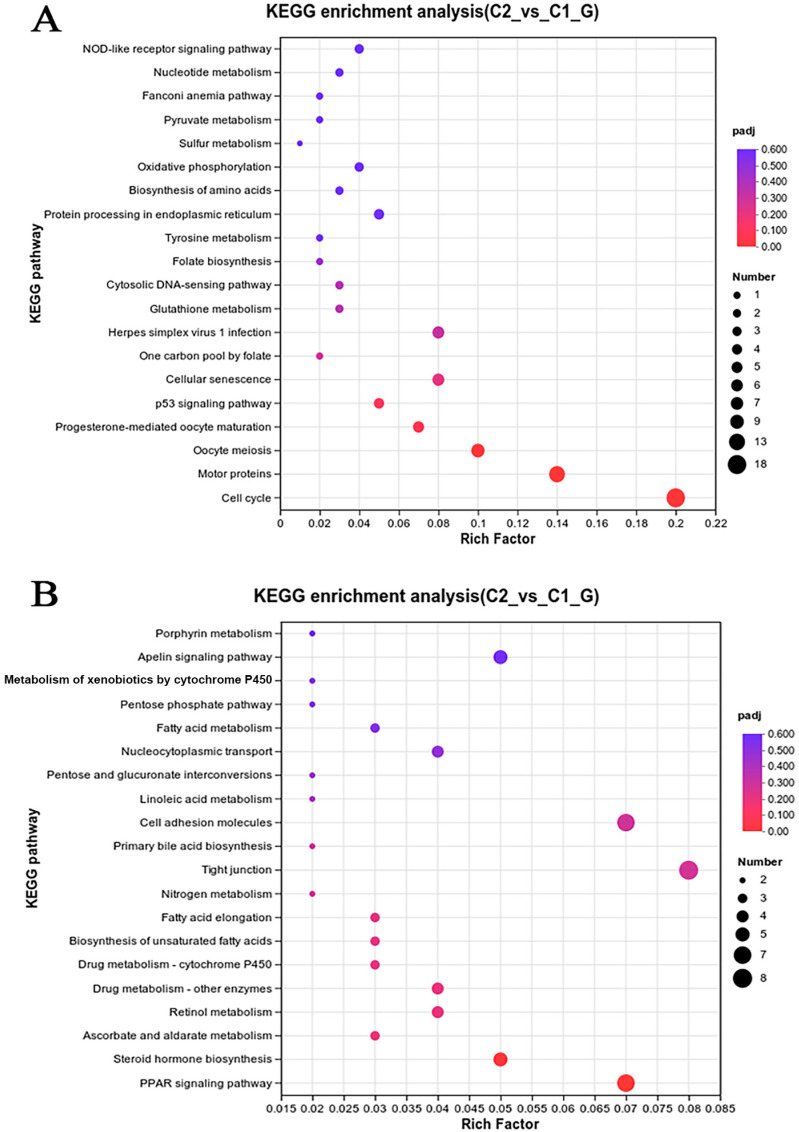
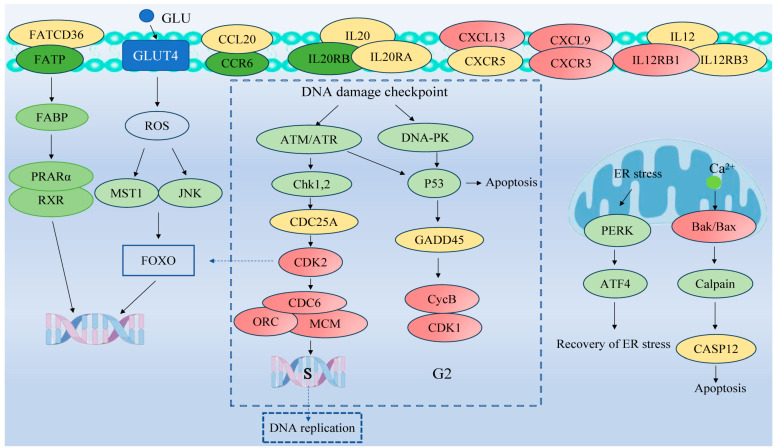
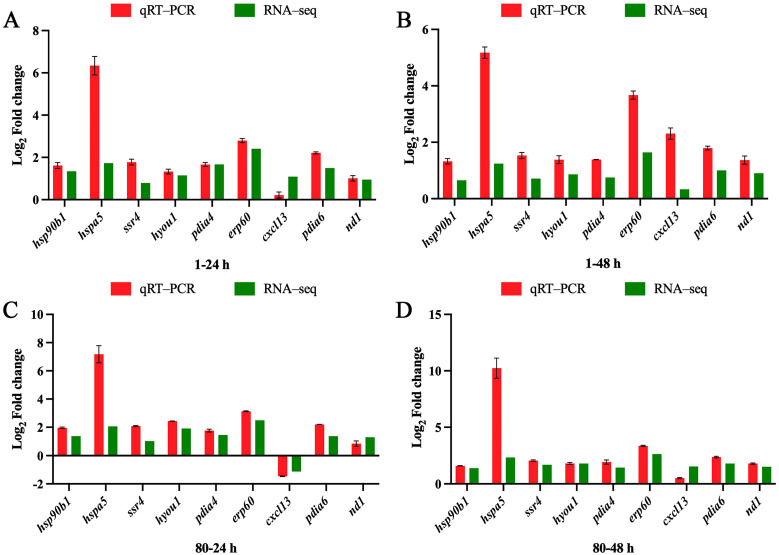
Background: As an innovative approach to deep-sea aquaculture, fish farm vessels offer a dual benefit by alleviating the pressure on offshore fishing resources while providing an additional high-quality protein source. However, the potential impacts of vessel coatings on farmed fish remain poorly understood. Methods: In this study, to investigate the effects of vessel coatings on the large yellow croaker (Larimichthys crocea), we established four experimental groups with coating concentrations at 1-fold, 10-fold, 20-fold, and 80-fold levels. Antioxidant enzyme activities in kidney tissues were measured across all groups, while histological and transcriptome analyses were specifically conducted for the 1-fold and 80-fold concentration groups. Results: Firstly, significant alterations in antioxidant enzyme activity were observed in the 80-fold concentration group. Moreover, histological analysis demonstrated more severe pathological changes in kidney tissue at the higher concentration, including interstitial hemorrhage and tubular epithelial cell fatty degeneration. In addition, we identified 11,902 differentially expressed genes (DEGs) by high-throughput sequencing. KEGG pathway enrichment analysis revealed that the DEGs were predominantly involved in critical biological processes, including endoplasmic reticulum protein processing, oxidative phosphorylation, cytokine-cytokine receptor interactions, cell cycle regulation, DNA replication, and PPAR signaling pathways. Finally, the validation of nine selected DEGs through quantitative real-time PCR (qRT-PCR) showed significant correlation with RNA-Seq data, confirming the reliability of our transcriptome analysis. Conclusions: This study provides preliminary insights into the antioxidant stress response mechanisms of L. crocea to coating exposure and establishes a theoretical foundation for optimizing healthy fish farming practices in aquaculture vessels.
Keywords: RNA-seq; antioxidant enzyme activities; aquaculture vessel coatings; fish; histology.
Conflict of interest statement
Authors (Xuan Xu, Huayu Song, Lu Zhang, Qiang Fu) were employed by the company Qingdao Conson Oceantec Valley Development Co., Ltd. The remaining authors declare that the research was conducted in the absence of any commercial or financial relationships that could be construed as a potential conflict of interest.
Figures
References
-
- Mjåtveit M.A., Cheng H., Ong M.C., Lee J. Comparative study of circular and square gravity-based fish cages with different dimensions under pure current conditions. Aquac. Eng. 2022;96:102223.
-
- Wang P.H., Chen Z.G., Feng Y.K. Many-objective optimization for a deep-sea aquaculture vessel based on an improved RBF neural network surrogate model. J. Mar. Sci. Technol. 2021;26:582–605. doi: 10.1007/s00773-020-00756-z. - DOI
-
- Cheng H., Li L., Aarsaether K.G., Ong M.C. Typical hydrodynamic models for aquaculture nets: A comparative study under pure current conditions. Aquac. Eng. 2020;90:102070.
-
- Liu Q., Chen H., Wang B.L. A true double-body method based on porous media model for simulation and froude scaling verification of an aquaculture vessel resistance. Ocean Eng. 2024;310:118501.
-
- Xiong Z., He M., Zhu W., Sun Y., Hou X. Analysis of Flow Field Characteristics of Aquaculture Cabin of Aquaculture Ship. J. Mar. Sci. Eng. 2023;11:390. doi: 10.3390/jmse11020390. - DOI
MeSH terms
Substances
Grants and funding
LinkOut - more resources
Full Text Sources
Medical
Research Materials
