. 2025 Mar 29;16(4):397.
doi: 10.3390/genes16040397.

Identification and Characterization of LINE and SINE Retrotransposons in the African Hedgehog (Atelerix albiventris, Erinaceidae) and Their Association with 3D Genome Organization and Gene Expression

Affiliations

Identification and Characterization of LINE and SINE Retrotransposons in the African Hedgehog (Atelerix albiventris, Erinaceidae) and Their Association with 3D Genome Organization and Gene Expression

Mengyuan Zhu et al. Genes (Basel). .

Abstract

Background: The African hedgehog (Atelerix albiventris) exhibits specialized skin differentiation leading to spine formation, yet its regulatory mechanisms remain unclear. Transposable elements (TEs), particularly LINEs (long interspersed nuclear elements) and SINEs (short interspersed nuclear elements), are known to influence genome organization and gene regulation.

Objectives: Given the high proportion of SINEs in the hedgehog genome, this study aims to characterize the distribution, evolutionary dynamics, and potential regulatory roles of LINEs and SINEs, focusing on their associations with chromatin architecture, DNA methylation, and gene expression.

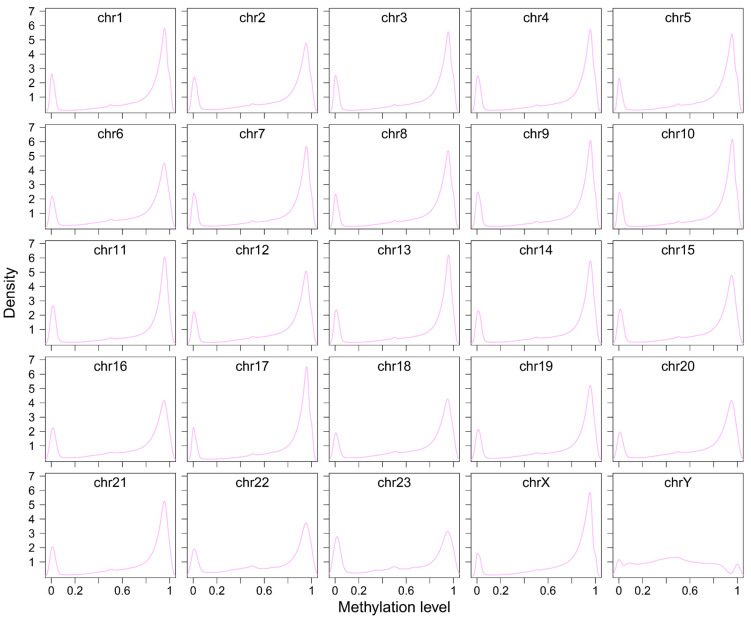
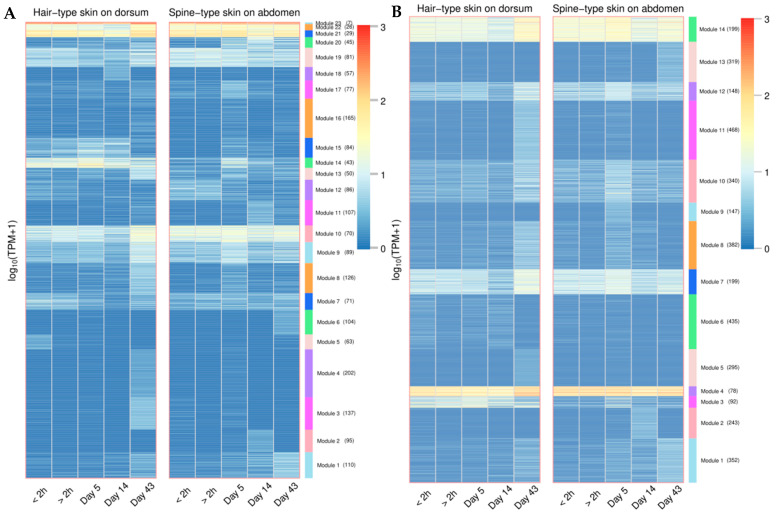
Methods: We analyzed LINE and SINE distribution using HiFi sequencing and classified TE families through phylogenetic reconstruction. Hi-C data were used to explore TE interactions with chromatin architecture, while whole-genome 5mCpG methylation was inferred from PacBio HiFi reads of muscle tissue using a deep-learning-based approach. RNA-seq data from skin tissues were analyzed to assess TE expression and potential associations with genes linked to spine development.

Results: SINEs form distinct genomic blocks in GC-rich and highly methylated regions, whereas LINEs are enriched in AT-rich, hypomethylated regions. LINEs and SINEs are associated differently with A/B compartments, with SINEs in euchromatin and LINEs in heterochromatin. Methylation analysis suggests that younger TEs tend to have higher methylation levels, and expression analysis indicates that some differentially expressed TEs may be linked to genes involved in epidermal and skeletal development.

Conclusions: This study provides a genome-wide perspective on LINE and SINE distribution, methylation patterns, and potential regulatory roles in A. albiventris. While not establishing a direct causal link, the findings suggest that TEs may influence gene expression associated with spine development, offering a basis for future functional studies.

Keywords: Atelerix albiventris; LINEs (long interspersed nuclear elements); SINEs (short interspersed nuclear elements); genome structure; repetitive sequences.


Conflict of interest statement

The authors declare no competing interests. The funders had no role in the design of the study; in the collection, analyses, or interpretation of data; in the writing of the manuscript; or in the decision to publish the results.

Figures

Figure A1
Figure A1
The summary of LINE and SINE annotations in the A. albiventris genome includes three plots: the top plot displays the number of consensus sequences for LINEs and SINEs; the middle plot shows the number of de novo and homologous alignments for LINEs; the bottom plot presents the number of de novo and homologous alignments for SINEs.
Figure A2
Figure A2
The copy number (A), length (B), and proportion of genome (C) of the LINE consensus sequences.
Figure A3
Figure A3
The copy number (A), length (B), and proportion of genome (C) of the SINE consensus sequences.
Figure A4
Figure A4
The heatmap shows the logarithms of p-values from random distribution tests of LINEs and SINEs.
Figure A5
Figure A5
The genomic annotation of LINEs and SINEs: (A) Upset plot of annotation information of LINEs. (B) Upset plot of annotation information of SINEs. (C) Pie plot of annotation information of LINEs and SINEs. Some categories may not be included in the pie chart, causing the total to be less than 100%.
Figure A6
Figure A6
Evolution and activity analysis of LINEs and SINEs in the A. albiventris: (A,B) Maximum likelihood phylogenetic tree of both known and novel of LINE and SINE families. (C) Similarity between the core region of the SINE family and the non-tRNA fragments of UnS-4_aAlb in A. albiventris; Red indicates the labeled genomic regions. (D) Sequence alignment of the DeuSINE domain with UnS-3_aAlb sequence. Red indicates the labeled genomic regions. (E) Insertion age distribution of LINEs and SINEs.
Figure A7
Figure A7
Distribution of the number (A), length (B), and copy number (C) of consensus sequences of different LINE1 subfamilies.
Figure A8
Figure A8
Distribution of the number (A), length (B), and copy number (C) of consensus sequences of different tRNA-SINE subfamilies.
Figure A9
Figure A9
Density plot of GC content of LINEs and SINEs across all chromosomes.
Figure A10
Figure A10
The ratio of LINEs (A) and SINEs (B) GC content to the whole genome for each chromosome.
Figure A11
Figure A11
Scatter plots and correlation coefficients between LINE content and its GC proportion for each chromosome.
Figure A12
Figure A12
Scatter plots and correlation coefficients between SINE content and its GC proportion for each chromosome.
Figure A13
Figure A13
The boxplot of GC content of LINEs (A) and SINEs (B) in different insert intervals. Lowercase letters in the plot indicate the differences among the insert intervals for GC content.
Figure A14
Figure A14
The density plot of methylation levels for each chromosome.
Figure A15
Figure A15
The distribution of methylation sites across all chromosomes. Pink represents hypermethylation and grey represents hypomethylation.
Figure A16
Figure A16
Heatmap of normalized interaction frequencies at 100 kb resolution for each chromosome. Under the heatmap, we show genomic distributions and densities of LINEs and SINEs and eigenvalues of the Hi-C matrix representing A/B compartments. In the figure, green represents LINE and pink represents SINE, red represents compartment A, and blue represents compartment B.
Figure A16
Figure A16
Heatmap of normalized interaction frequencies at 100 kb resolution for each chromosome. Under the heatmap, we show genomic distributions and densities of LINEs and SINEs and eigenvalues of the Hi-C matrix representing A/B compartments. In the figure, green represents LINE and pink represents SINE, red represents compartment A, and blue represents compartment B.
Figure A17
Figure A17
Boxplots showing LINE (A) and SINE (B) family’s content in A and B compartments. The light red color indicated A compartment, and the light blue indicated B compartment.
Figure A18
Figure A18
Scatter plot of R2 vs. −log 10 of the p-values depicting differential LINE and SINE expression between abdomen hair and dorsal spine tissues. The blue line represents a standard baseline.
Figure A19
Figure A19
Heatmap of hierarchical clustering analysis for differentially expressed LINEs (DELs) (A) and SINEs (DESs) (B) in hair-type skin on the dorsum and spine-type skin on the abdomen across different developmental stages. Modules are represented by different colored bars and numbered according to clustering results.
Figure 1
Figure 1
Distribution characteristics of LINEs and SINEs in the A. albiventris genome. (A) Distribution of LINE and SINE counts and sequence lengths across 250 kb genomic windows, arranged (outer to inner): LINE count, SINE count, LINE length, and SINE length. Green indicates the distribution of LINEs (long interspersed elements); pink indicates the distribution of SINEs (short interspersed elements); blue is used to mark chromosome locations. (B) Histogram displaying the proportions of LINEs and SINEs across each chromosome. Green bars indicate LINE proportions, pink bars represent SINE proportions, and blue bars show the combined proportion of LINEs and SINEs. (C) Standard deviation (SD) of LINE and SINE sequence lengths and count across chromosomes. The top panel shows SD for counts, while the bottom panel shows SD for sequence lengths. Green and pink bars correspond to LINEs and SINEs, respectively. (D) Proportion of LINEs and SINEs at varying proximity distances. Rows represent chromosomes, and columns indicate distance categories. Warmer colors denote higher proportions. (E) The genomic distribution of LINE and SINE blocks. LINE blocks are marked in blue, and SINE blocks are marked in pink. Genomic coordinates are arranged circularly around the plot.
Figure 2
Figure 2
Genic LINEs and SINEs associated with gene function in the A. albiventris genome. (A) Bar plot showing the proportion (%) of LINEs (green) and SINEs (pink) located near genic regions (within 3 kb). (B) Genomic annotation of LINE and SINE families within genic regions. The heatmap displays the proportions of these elements in specific genomic features, including promoters, introns, exons, downstream regions, 5′ UTRs, and 3′ UTRs. Color intensity reflects the relative abundance of each repeat type in the corresponding genomic feature. Different colors indicate the relative abundance of transposon (TE) types: red represents the highest proportion, yellow/white represents a medium proportion, and blue represents a low proportion. The green and pink bars on the right mark the LINE and SINE categories, respectively, for easy classification visualization. (C) Venn diagram illustrating the overlap between gene sets associated with LINEs (pink) and SINEs (green). The central overlap represents genes enriched for both LINE and SINE elements, while the non-overlapping sections represent LINE-specific and SINE-specific genes. (D,E) Cumulative distribution curves (CDC) comparing GO analysis of genes neighbored by LINEs and SINEs versus random gene sets. (F) GO enrichment analysis of LINE-specific and SINE-specific genes defined in (C).
Figure 3
Figure 3
Evolution and activity analysis of LINE1 (A) and tRNA-SINE (B) subfamilies in the A. albiventris. The tree represents the evolutionary relationships among different subfamilies, with branch colors showing individual subfamilies. Node sizes indicate the copy number of each subfamily, with larger nodes representing higher copy numbers. Insets show histograms of the age distribution (millions of years ago, Mya) for specific subfamilies, illustrating their historical activity levels.
Figure 4
Figure 4
Influence of genomic GC content on retrotransposon distribution in the A. albiventris genome. (A) Density plot illustrating the GC content distribution for LINEs (green), SINEs (pink), and the entire genome (gray). (B) Boxplot representing the log10-transformed GC content ratios of LINEs and SINEs compared to the genome-wide average. The dashed line indicates a ratio of 1 (equal GC content), while deviations highlight enrichment or depletion in GC content. (C) Boxplot displaying the correlation coefficients between insert length and GC content for LINEs and SINEs. (D,E) Scatter plots showing the relationship between retrotransposon GC content and insertion age for LINEs ((D), green) and SINEs ((E), pink). Each point represents a retrotransposon insertion event, with the fitted regression lines and correlation coefficients (r) indicating the strength and direction of the association.
Figure 5
Figure 5
Methylation landscape of LINEs and SINEs in the A. albiventris genome: (A) The distribution of DNA methylation levels for LINEs (green) and SINEs (pink) across the genome. (B) Relationships between LINE (left, green) and SINE (right, pink) sequence length and the number of methylation sites. Trend lines and correlation coefficients (r) quantify the strength and direction of these associations. (C) Bar charts compare the percentage of methylation sites located within LINEs and SINEs (left) and the proportion of LINE and SINE sequences that are methylated (right), emphasizing contrasts in methylation enrichment. (D) The correlation between the length of methylated sequences and the number of methylation sites is shown for LINEs (left, green) and SINEs (right, pink). (E) Proportion of methylation sites near gene regions versus distal intergenic regions for LINEs and SINEs. (F) Scatter plots demonstrate the decline in the proportion of methylated sequences with increasing insertion age for LINEs (left, green) and SINEs (right, pink).
Figure 6
Figure 6
LINE and SINE-rich genomic regions and their association with 3D genome structure: (A) Heatmap of normalized interaction frequencies at 100 kb resolution on chromosome 1. Below the heatmap, tracks depict the genomic distribution and densities of LINEs (green) and SINEs (pink), as well as the eigenvalues of the Hi-C matrix, delineating A (positive, red) and B (negative, blue) compartments. In the figure, green represents LINE and pink represents SINE, red represents compartment A, and blue represents compartment B. (B) Boxplots comparing the proportion of LINEs and SINEs in A and B compartments. The statistical significance between compartments is annotated above the plots, highlighting compartment-specific enrichment. (C) Relative content of LINE and SINE repeats across A and B compartments in different chromosomes. Variations in repeat densities are visualized, with chromosomes partitioned by their compartmental organization. (D) Boxplots illustrating the frequency of chromatin interactions between LINE-LINE, SINE-SINE, and LINE-SINE pairs. (E) Zoomed-in view of interaction matrix for the genomic region from 10 to 30 Mb on chr2. Below the heatmap: genomic distributions of LINEs, SINEs, A/B compartments, TADs, and loops. LINE-rich regions are labeled as M and N (uppercase), and SINE-rich regions as j and k (lowercase). In the figure, green represents LINE and pink represents SINE, bright red represents compartment A, blue represents compartment B, light yellow represents TAD, light blue represents loop, and gray represents gene. (F) Proportion of TADs and loops in LINE and SINE-rich regions.
Figure 7
Figure 7
LINEs and SINEs involved in skin development in A. albiventris: (A) Proportion of LINEs, SINEs, and genes in each category for the corresponding analysis. These include all transposable elements, expressed LINEs and SINEs, and differentially expressed LINEs (DELs) and SINEs (DESs). (B) The histogram of different ranges of TPM values. On the left is LINE and on the right is SINE. (C) The boxplot of LINE and SINE expression TPM values (greater than 0.5).

Similar articles

References

    1. Santana E.M., Jantz H.E., Best T.L. Atelerix albiventris (Erinaceomorpha: Erinaceidae) Mamm. Species. 2010;42:99–110. doi: 10.1644/857.1. - DOI
    1. Grzesiakowska A., Baran P., Kuchta-Gładysz M., Szeleszczuk O. Cytogenetic karyotype analysis in selected species of the family. J. Vet. Res. 2019;63:353–358. doi: 10.2478/jvetres-2019-0041. - DOI - PMC - PubMed
    1. Jiang L., Xu J., Zhu M., Lv Z., Ning Z., Yang F. A haplotype-resolved genome reveals the genetic basis of spine formation in Atelerix albiventris. J. Genet. Genom. 2024;51:1529–1532. doi: 10.1016/j.jgg.2024.06.012. - DOI - PubMed
    1. Yang N., Zhao B., Chen Y., D’Alessandro E., Chen C., Ji T., Song C. Distinct retrotransposon evolution profile in the genome of rabbit (Oryctolagus cuniculus) Genome Biol. Evol. 2021;13:evab168. doi: 10.1093/gbe/evab168. - DOI - PMC - PubMed
    1. Beck C.R., Collier P., Macfarlane C., Malig M., Kidd J.M., Eichler E.E., Moran J.V. LINE-1 retrotransposition activity in human genomes. Cell. 2010;141:1159–1170. doi: 10.1016/j.cell.2010.05.021. - DOI - PMC - PubMed

LinkOut - more resources